
Differential Regulation of POC5 by ERα in Human Normal and Scoliotic Cells

 , and
, and
Abstract
:
1. Introduction
2. Materials and Methods
2.1. In-Silico Analysis of Gene Expression
2.2. Cells and Treatments
2.3. Samples, Osteoblast Isolation, and Culture
2.4. Alizarin Red Staining
2.5. Alkaline Phosphatase (ALP) Staining
2.6. RNA Isolation, Reverse Transcription, PCR, and Real-Time PCR
2.7. Plasmid Construction
2.8. In-Silico Analysis of the POC5 Promoter
2.9. Protein Lysate Preparation and Western Blotting
2.10. Transient Transfection Assays
2.11. Immunofluorescence
2.12. Chromatin Immunoprecipitation (ChIP)
2.13. Thymidine Incorporation Assay
2.14. Statistical Analysis
3. Results
3.1. Gene Expression Profile of POC5 in Multiple Human Tissues
3.2. The POC5A429V AIS Osteoblasts Have a Reduced Mineralization Rate Compared to NOB Cells
3.3. Centriolar Protein POC5 Is Expressed at Higher Levels in NOBs Compared to Mutant POC5A429V AIS Osteoblasts
3.4. Estrogen Upregulates POC5 Expression in a Dose-Dependent Manner in Control NOBs but Not in Mutant POC5A429V AIS Osteoblasts
3.5. E2 Upregulates POC5 Gene and Protein Expression Levels in MCF-7 and Huh-7 Cells
3.6. ERα Antagonists Attenuate the E2-Induced Regulation of POC5
3.7. The Proximal Promoter Region of POC5 Confers Estrogen Responsiveness through ERα
3.8. Estrogen-Dependent Recruitment of ERα to the POC5 Proximal Promoter
3.9. E2 Upregulates Bone Markers and ER Isoforms in Control NOBs but Not in Mutant POC5A429V AIS Osteoblasts
4. Discussion
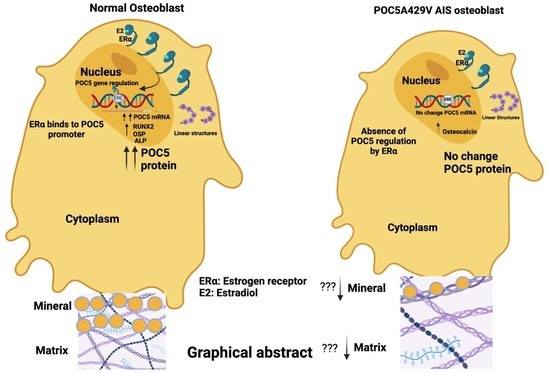
5. Conclusions
Supplementary Materials
Author Contributions
Funding
Institutional Review Board Statement
Informed Consent Statement
Data Availability Statement
Acknowledgments
Conflicts of Interest
References
- Altaf, F.; Gibson, A.; Dannawi, Z.; Noordeen, H. Adolescent idiopathic scoliosis. BMJ 2013, 346, f2508. [Google Scholar] [CrossRef] [PubMed]
- Cheng, J.C.; Castelein, R.M.; Chu, W.C.; Danielsson, A.J.; Dobbs, M.B.; Grivas, T.B.; Gurnett, C.A.; Luk, K.D.; Moreau, A.; Newton, P.O.; et al. Adolescent idiopathic scoliosis. Nat. Rev. Dis. Prim. 2015, 1, 15030. [Google Scholar] [CrossRef] [PubMed]
- Leboeuf, D.; Letellier, K.; Alos, N.; Edery, P.; Moldovan, F. Do estrogens impact adolescent idiopathic scoliosis? Trends Endocrinol. Metab. 2009, 20, 147–152. [Google Scholar] [CrossRef] [PubMed]
- Kikanloo, S.R.; Tarpada, S.P.; Cho, W. Etiology of Adolescent Idiopathic Scoliosis: A Literature Review. Asian Spine J. 2019, 13, 519–526. [Google Scholar] [CrossRef]
- Latalski, M.; Danielewicz-Bromberek, A.; Fatyga, M.; Latalska, M.; Krober, M.; Zwolak, P. Current insights into the aetiology of adolescent idiopathic scoliosis. Arch. Orthop. Trauma Surg. 2017, 137, 1327–1333. [Google Scholar] [CrossRef]
- Burwell, R.G.; Clark, E.M.; Dangerfield, P.H.; Moulton, A. Adolescent idiopathic scoliosis (AIS): A multifactorial cascade concept for pathogenesis and embryonic origin. Scoliosis Spinal Disord. 2016, 11, 8. [Google Scholar] [CrossRef]
- Cheng, J.C.; Qin, L.; Cheung, C.S.; Sher, A.H.; Lee, K.M.; Ng, S.W.; Guo, X. Generalized low areal and volumetric bone mineral density in adolescent idiopathic scoliosis. J. Bone Miner. Res. 2000, 15, 1587–1595. [Google Scholar] [CrossRef]
- Cheng, J.C.; Tang, S.P.; Guo, X.; Chan, C.W.; Qin, L. Osteopenia in adolescent idiopathic scoliosis: A histomorphometric study. Spine 2001, 26, E19–E23. [Google Scholar] [CrossRef]
- Lam, T.P.; Hung, V.W.; Yeung, H.Y.; Tse, Y.K.; Chu, W.C.; Ng, B.K.; Lee, K.M.; Qin, L.; Cheng, J.C. Abnormal bone quality in adolescent idiopathic scoliosis: A case-control study on 635 subjects and 269 normal controls with bone densitometry and quantitative ultrasound. Spine 2011, 36, 1211–1217. [Google Scholar] [CrossRef]
- Sun, X.; Wu, T.; Liu, Z.; Zhu, Z.; Qian, B.; Zhu, F.; Ma, W.; Yu, Y.; Wang, B.; Qiu, Y. Osteopenia predicts curve progression of adolescent idiopathic scoliosis in girls treated with brace treatment. J. Pediatr. Orthop. 2013, 33, 366–371. [Google Scholar] [CrossRef]
- Peng, Y.; Liang, G.; Pei, Y.; Ye, W.; Liang, A.; Su, P. Genomic polymorphisms of G-protein estrogen receptor 1 are associated with severity of adolescent idiopathic scoliosis. Int. Orthop. 2012, 36, 671–677. [Google Scholar] [CrossRef] [PubMed]
- Janusz, P.; Kotwicka, M.; Andrusiewicz, M.; Czaprowski, D.; Czubak, J.; Kotwicki, T. Estrogen receptors genes polymorphisms and age at menarche in idiopathic scoliosis. BMC Musculoskelet. Disord. 2014, 15, 383. [Google Scholar] [CrossRef] [PubMed]
- Yang, M.; Li, C.; Li, M. The estrogen receptor α gene (XbaI, PvuII) polymorphisms and susceptibility to idiopathic scoliosis: A meta-analysis. J. Orthop. Sci. 2014, 19, 713–721. [Google Scholar] [CrossRef] [PubMed]
- Zhang, H.Q.; Lu, S.J.; Tang, M.X.; Chen, L.Q.; Liu, S.H.; Guo, C.F.; Wang, X.Y.; Chen, J.; Xie, L. Association of estrogen receptor β gene polymorphisms with susceptibility to adolescent idiopathic scoliosis. Spine 2009, 34, 760–764. [Google Scholar] [CrossRef]
- Zhao, L.; Roffey, D.M.; Chen, S. Association Between the Estrogen Receptor β (ESR2) Rs1256120 Single Nucleotide Polymorphism and Adolescent Idiopathic Scoliosis: A Systematic Review and Meta-Analysis. Spine 2017, 42, 871–878. [Google Scholar] [CrossRef]
- Kotwicki, T.; Janusz, P.; Andrusiewicz, M.; Chmielewska, M.; Kotwicka, M. Estrogen receptor 2 gene polymorphism in idiopathic scoliosis. Spine 2014, 39, E1599–E1607. [Google Scholar] [CrossRef]
- Janusz, P.; Kotwicki, T.; Andrusiewicz, M.; Kotwicka, M. XbaI and PvuII polymorphisms of estrogen receptor 1 gene in females with idiopathic scoliosis: No association with occurrence or clinical form. PLoS ONE 2013, 8, e76806. [Google Scholar] [CrossRef]
- Takahashi, Y.; Matsumoto, M.; Karasugi, T.; Watanabe, K.; Chiba, K.; Kawakami, N.; Tsuji, T.; Uno, K.; Suzuki, T.; Ito, M.; et al. Replication study of the association between adolescent idiopathic scoliosis and two estrogen receptor genes. J. Orthop. Res. 2011, 29, 834–837. [Google Scholar] [CrossRef]
- Inoue, M.; Minami, S.; Nakata, Y.; Kitahara, H.; Otsuka, Y.; Isobe, K.; Takaso, M.; Tokunaga, M.; Nishikawa, S.; Maruta, T.; et al. Association between estrogen receptor gene polymorphisms and curve severity of idiopathic scoliosis. Spine 2002, 27, 2357–2362. [Google Scholar] [CrossRef]
- Wu, J.; Qiu, Y.; Zhang, L.; Sun, Q.; Qiu, X.; He, Y. Association of estrogen receptor gene polymorphisms with susceptibility to adolescent idiopathic scoliosis. Spine 2006, 31, 1131–1136. [Google Scholar] [CrossRef]
- Eastell, R. Role of oestrogen in the regulation of bone turnover at the menarche. J. Endocrinol. 2005, 185, 223–234. [Google Scholar] [CrossRef] [PubMed]
- Grivas, T.B.; Vasiliadis, E.; Mouzakis, V.; Mihas, C.; Koufopoulos, G. Association between adolescent idiopathic scoliosis prevalence and age at menarche in different geographic latitudes. Scoliosis 2006, 1, 9. [Google Scholar] [CrossRef]
- Patten, S.A.; Margaritte-Jeannin, P.; Bernard, J.C.; Alix, E.; Labalme, A.; Besson, A.; Girard, S.L.; Fendri, K.; Fraisse, N.; Biot, B.; et al. Functional variants of POC5 identified in patients with idiopathic scoliosis. J. Clin. Investig. 2015, 125, 1124–1128. [Google Scholar] [CrossRef] [PubMed]
- Xu, L.; Sheng, F.; Xia, C.; Li, Y.; Feng, Z.; Qiu, Y.; Zhu, Z. Common variant of POC5 is associated with the susceptibility of adolescent idiopathic scoliosis. Spine 2017, 43, E683–E688. [Google Scholar] [CrossRef] [PubMed]
- Azimzadeh, J.; Hergert, P.; Delouvee, A.; Euteneuer, U.; Formstecher, E.; Khodjakov, A.; Bornens, M. hPOC5 is a centrin-binding protein required for assembly of full-length centrioles. J. Cell Biol. 2009, 185, 101–114. [Google Scholar] [CrossRef]
- Dantas, T.J.; Daly, O.M.; Conroy, P.C.; Tomas, M.; Wang, Y.; Lalor, P.; Dockery, P.; Ferrando-May, E.; Morrison, C.G. Calcium-binding capacity of centrin2 is required for linear POC5 assembly but not for nucleotide excision repair. PLoS ONE 2013, 8, e68487. [Google Scholar] [CrossRef]
- Bagu, E.T.; Santos, M.M. Friend of GATA suppresses the GATA-induced transcription of hepcidin in hepatocytes through a GATA-regulatory element in the HAMP promoter. J. Mol. Endocrinol. 2011, 47, 299–313. [Google Scholar] [CrossRef]
- Hassan, A.; Bagu, E.T.; Levesque, M.; Patten, S.A.; Benhadjeba, S.; Edjekouane, L.; Villemure, I.; Tremblay, A.; Moldovan, F. The 17beta-estradiol induced upregulation of the adhesion G-protein coupled receptor (ADGRG7) is modulated by ESRalpha and SP1 complex. Biol. Open 2019, 8, bio037390. [Google Scholar] [CrossRef]
- Letellier, K.; Azeddine, B.; Parent, S.; Labelle, H.; Rompre, P.H.; Moreau, A.; Moldovan, F. Estrogen cross-talk with the melatonin signaling pathway in human osteoblasts derived from adolescent idiopathic scoliosis patients. J. Pineal Res. 2008, 45, 383–393. [Google Scholar] [CrossRef]
- Edjekouane, L.; Benhadjeba, S.; Jangal, M.; Fleury, H.; Gevry, N.; Carmona, E.; Tremblay, A. Proximal and distal regulation of the HYAL1 gene cluster by the estrogen receptor α in breast cancer cells. Oncotarget 2016, 7, 77276–77290. [Google Scholar] [CrossRef]
- Giampietro, P.F.; Hadley-Miller, N.; Raggio, C.L. Overview of Gene Special Issue “Genetic Conditions Affecting the Skeleton: Congenital, Idiopathic Scoliosis and Arthrogryposis”. Genes 2022, 13, 1194. [Google Scholar] [CrossRef] [PubMed]
- Baschal, E.E.; Swindle, K.; Justice, C.M.; Baschal, R.M.; Perera, A.; Wethey, C.I.; Poole, A.; Pourquié, O.; Tassy, O.; Miller, N.H. Sequencing of the TBX6 Gene in Families with Familial Idiopathic Scoliosis. Spine Deform. 2015, 3, 288–296. [Google Scholar] [CrossRef] [PubMed]
- Makrythanasis, P.; Temtamy, S.; Aglan, M.S.; Otaify, G.A.; Hamamy, H.; Antonarakis, S.E. A novel homozygous mutation in FGFR3 causes tall stature, severe lateral tibial deviation, scoliosis, hearing impairment, camptodactyly, and arachnodactyly. Hum. Mutat. 2014, 35, 959. [Google Scholar] [CrossRef]
- Takahashi, Y.; Kou, I.; Takahashi, A.; Johnson, T.A.; Kono, K.; Kawakami, N.; Uno, K.; Ito, M.; Minami, S.; Yanagida, H.; et al. A genome-wide association study identifies common variants near LBX1 associated with adolescent idiopathic scoliosis. Nat. Genet. 2011, 43, 1237–1240. [Google Scholar] [CrossRef] [PubMed]
- Mathieu, H.; Patten, S.A.; Aragon-Martin, J.A.; Ocaka, L.; Simpson, M.; Child, A.; Moldovan, F. Genetic variant of TTLL11 gene and subsequent ciliary defects are associated with idiopathic scoliosis in a 5-generation UK family. Sci Rep. 2021, 11, 11026. [Google Scholar] [CrossRef]
- Hayes, M.; Gao, X.; Yu, L.X.; Paria, N.; Henkelman, R.M.; Wise, C.A.; Ciruna, B. ptk7 mutant zebrafish models of congenital and idiopathic scoliosis implicate dysregulated Wnt signalling in disease. Nat. Commun. 2014, 5, 4777. [Google Scholar] [CrossRef]
- Grimes, F.D.T.; Boswell, C.W.; Morante, N.F.C.; Henkelman, R.M.; Burdine, R.D.; Ciruna, B. Zebrafish models of idiopathic scoliosis link cerebrospinal fluid flow defects to spine curvature. Science 2016, 352, 1341–1344. [Google Scholar] [CrossRef]
- Mathieu, H.; Spataru, A.; Aragon-Martin, J.A.; Child, A.; Barchi, S.; Fortin, C.; Parent, S.; Moldovan, F. Prevalence of POC5 Coding Variants in French-Canadian and British AIS Cohort. Genes 2021, 12, 1032. [Google Scholar] [CrossRef]
- Shi, L.; Lin, Q.; Su, B. Estrogen regulation of microcephaly genes and evolution of brain sexual dimorphism in primates. BMC Evol. Biol. 2015, 15, 127. [Google Scholar] [CrossRef]
- Li, J.J.; Weroha, S.J.; Lingle, W.L.; Papa, D.; Salisbury, J.L.; Li, S.A. Estrogen mediates Aurora-A overexpression, centrosome amplification, chromosomal instability, and breast cancer in female ACI rats. Proc. Natl. Acad. Sci. USA 2004, 101, 18123–18128. [Google Scholar] [CrossRef]
- Li, X.F.; Li, H.; Liu, Z.D.; Dai, L.Y. Low bone mineral status in adolescent idiopathic scoliosis. Eur. Spine J. 2008, 17, 1431–1440. [Google Scholar] [CrossRef] [PubMed]
- Wang, Z.W.; Lee, W.Y.; Lam, T.P.; Yip, B.H.; Yu, F.W.; Yu, W.S.; Zhu, F.; Ng, B.K.; Qiu, Y.; Cheng, J.C. Defining the bone morphometry, micro-architecture and volumetric density profile in osteopenic vs non-osteopenic adolescent idiopathic scoliosis. Eur. Spine J. 2017, 26, 1586–1594. [Google Scholar] [CrossRef] [PubMed]
- Smith, E.P.; Boyd, J.; Frank, G.R.; Takahashi, H.; Cohen, R.M.; Specker, B.; Williams, T.C.; Lubahn, D.B.; Korach, K.S. Estrogen resistance caused by a mutation in the estrogen-receptor gene in a man. N. Engl. J. Med. 1994, 331, 1056–1061. [Google Scholar] [CrossRef] [PubMed]
- Quaynor, S.D.; Stradtman, E.W., Jr.; Kim, H.G.; Shen, Y.; Chorich, L.P.; Schreihofer, D.A.; Layman, L.C. Delayed puberty and estrogen resistance in a woman with estrogen receptor α variant. N. Engl. J. Med. 2013, 369, 164–171. [Google Scholar] [CrossRef]
- Zhu, Z.; Tang, N.L.; Xu, L.; Qin, X.; Mao, S.; Song, Y.; Liu, L.; Li, F.; Liu, P.; Yi, L.; et al. Genome-wide association study identifies new susceptibility loci for adolescent idiopathic scoliosis in Chinese girls. Nat. Commun. 2015, 6, 8355. [Google Scholar] [CrossRef]
- Kou, I.; Takahashi, Y.; Johnson, T.A.; Takahashi, A.; Guo, L.; Dai, J.; Qiu, X.; Sharma, S.; Takimoto, A.; Ogura, Y.; et al. Genetic variants in GPR126 are associated with adolescent idiopathic scoliosis. Nat. Genet. 2013, 45, 676–679. [Google Scholar] [CrossRef]
- Qin, X.; Xu, L.; Xia, C.; Zhu, W.; Sun, W.; Liu, Z.; Qiu, Y.; Zhu, Z. Genetic Variant of GPR126 Gene is Functionally Associated With Adolescent Idiopathic Scoliosis in Chinese Population. Spine 2017, 42, E1098–E1103. [Google Scholar] [CrossRef]
- Liu, G.; Liu, S.; Lin, M.; Li, X.; Chen, W.; Zuo, Y.; Liu, J.; Niu, Y.; Zhao, S.; Long, B.; et al. Genetic polymorphisms of GPR126 are functionally associated with PUMC classifications of adolescent idiopathic scoliosis in a Northern Han population. J. Cell Mol. Med. 2018, 22, 1964–1971. [Google Scholar] [CrossRef]
- Xu, J.F.; Yang, G.H.; Pan, X.H.; Zhang, S.J.; Zhao, C.; Qiu, B.S.; Gu, H.F.; Hong, J.F.; Cao, L.; Chen, Y.; et al. Association of GPR126 gene polymorphism with adolescent idiopathic scoliosis in Chinese populations. Genomics 2015, 105, 101–107. [Google Scholar] [CrossRef]
- Liu, S.; Wu, N.; Zuo, Y.; Zhou, Y.; Liu, J.; Liu, Z.; Chen, W.; Liu, G.; Chen, Y.; Chen, J.; et al. Genetic Polymorphism of LBX1 Is Associated With Adolescent Idiopathic Scoliosis in Northern Chinese Han Population. Spine 2017, 42, 1125–1129. [Google Scholar] [CrossRef]
- Zhao, D.; Qiu, G.X.; Wang, Y.P.; Zhang, J.G.; Shen, J.X.; Wu, Z.H. Association between adolescent idiopathic scoliosis with double curve and polymorphisms of calmodulin1 gene/estrogen receptor-α gene. Orthop. Surg. 2009, 1, 222–230. [Google Scholar] [CrossRef]
- Coelho, P.A.; Bury, L.; Shahbazi, M.N.; Liakath-Ali, K.; Tate, P.H.; Wormald, S.; Hindley, C.J.; Huch, M.; Archer, J.; Skarnes, W.C.; et al. Over-expression of Plk4 induces centrosome amplification, loss of primary cilia and associated tissue hyperplasia in the mouse. Open Biol. 2015, 5, 150209. [Google Scholar] [CrossRef]


| Sex | Age of Surgery | Cobb Angle | Curve Type |
|---|---|---|---|
| F | 14 | 99–66 | rt/ll |
| F | 12 | 54 | rt/ll |
| M | 13 | 75 | rt |
| F | 14 | 68 | rt |
| F | 11 | 54–37 | rt |
| F | 18 | 37–52 | rt/ll |
| F | 13 | 56 | rt |
| F | 14 | 67 | rt |
| F | 16 | 64 | rt |
| F | 12 | 68 | rt |
| F | 16 | 58 | rt |
| F | 13 | 66 | rt |
| F | 13 | 51 | rt |
| F | 14 | 78 | rt |
| F | 14 | 41–48 | rt/ll |
| F | 13 | 54 | rt |
| F | 14 | 88 | rt |
| F | 15 | 32 | rtl |
| F | 18 | 50 | rtl |
| F | 13 | 58–49 | rt |
| F | 16 | 53 | rt/ll |
| F | 12 | 74–62 | rt |
| F | 14 | 41–50 | rt/ll |
| F | 14 | 81–59 | rt/ll |
| F | 13 | 53 | rt |
| F | 15 | 55–42 | rt/ll |
| F | 13 | 61 | rt |
| F | 15 | 58 | rt |
| M | 14 | 61 | rt |
| F | 15 | 72–59 | rt/ll |
| F | 16 | 28 | rt |
| F | 12 | 65 | rt |
| F | 15 | 42 | rt |
| M | 18 | 70 | rt |
| Primer Name | Primer Sequence |
|---|---|
| GAPDH_Sense | 5′AGGAGTAAGACCCCTGGACC3′ |
| GAPDH_AntiSense | 5′GGAGATTCAGTGTGGTGGGG3′ |
| POC5_Sense | 5′CATGTCAGAGCCAGACAGGA3′ |
| POC5_AntiSense | 5′GGAACGCCAGACTTTCCAGA3′ |
| ALP_Sense | 5′ACACCTGGAAGAGCTTCAAACCGA3′ |
| ALP_AntiSense | 5′TCCACCAAATGTGAAGACGTGGGA3′ |
| OSTEOCALCIN_Sense | 5′ACACTCCTCGCCCTATTG3′ |
| OSTEOCALCIN_AntiSense | 5′GATGTGGTCAGCCAACTC3′ |
| RUNX2_Sense | 5′TCCGGAATGCCTCTGCTGTTATGA3′ |
| RUNX2_AntiSense | 5′ACTGAGGCGGTCAGAGAACAAACT3′ |
| OSTEOPONTIN_Sense | 5′CAGCCATGAATTTCACAGCC3′ |
| OSTEOPONTIN_AntiSense | 5′GGGAGTTTCCATGAA GCCAC3′ |
| Primer | Position | Sequence |
|---|---|---|
| Sense | −3661/−3641 | 5′CCAGCAGGCTAGCCCAGGCGT 3′ |
| Anti-sense | −1478/−1448 | 5′GTCTTTCAACTTACATTGGCAACAGATAGGC 3′ |
| Sense | −1481/−1455 | 5′CATACCTGCTAGCCTATCTGTTGCCAATGTAAGTT 3′ |
| Sense | −555/−536 | 5′CTGCACACCAGCCTGGACGGGCTAGCAAGACTCCATCTCAAAA 3′ |
| Sense | −248/−230 | 5′GAAAGCCAACAGCACACGGCGCTAGCCAACTTCAGCCCTGC3′ |
| Primer Name | Sequence |
|---|---|
| POC5_CHIP_ERE1/2_Sense | 5′ GGGATCTGTGGATGATGCAG 3′ |
| POC5_CHIP_ERE1/2_Antisense | 5′ GAGTTCGAGACTAGTCTGGG 3′ |
| POC5_CHIP_ERE3_Sense | 5′ GCCCAGAATTTCGGATTGTTC 3′ |
| POC5_CHIP_ERE3_AntiSense | 5′ CTGAAGTTGGCTAATGCCGTG 3′ |
Disclaimer/Publisher’s Note: The statements, opinions and data contained in all publications are solely those of the individual author(s) and contributor(s) and not of MDPI and/or the editor(s). MDPI and/or the editor(s) disclaim responsibility for any injury to people or property resulting from any ideas, methods, instructions or products referred to in the content. |
© 2023 by the authors. Licensee MDPI, Basel, Switzerland. This article is an open access article distributed under the terms and conditions of the Creative Commons Attribution (CC BY) license (https://creativecommons.org/licenses/by/4.0/).
Share and Cite
Hassan, A.; Bagu, E.T.; Patten, S.A.; Molidperee, S.; Parent, S.; Barchi, S.; Villemure, I.; Tremblay, A.; Moldovan, F. Differential Regulation of POC5 by ERα in Human Normal and Scoliotic Cells. Genes 2023, 14, 1111. https://doi.org/10.3390/genes14051111
Hassan A, Bagu ET, Patten SA, Molidperee S, Parent S, Barchi S, Villemure I, Tremblay A, Moldovan F. Differential Regulation of POC5 by ERα in Human Normal and Scoliotic Cells. Genes. 2023; 14(5):1111. https://doi.org/10.3390/genes14051111
Chicago/Turabian StyleHassan, Amani, Edward T. Bagu, Shunmoogum A. Patten, Sirinart Molidperee, Stefan Parent, Soraya Barchi, Isabelle Villemure, André Tremblay, and Florina Moldovan. 2023. "Differential Regulation of POC5 by ERα in Human Normal and Scoliotic Cells" Genes 14, no. 5: 1111. https://doi.org/10.3390/genes14051111