


Abstract
Increasing active transport is proposed as a means to address both health and environmental issues. However, the associations between specific modes, such as cycling, walking and public transport, and health outcomes remain unclear. We examined the association between mode of travel to work and mortality.
Cohort studies of the entire New Zealand working population were created using 1996, 2001 and 2006 censuses linked to mortality data. Mode of travel to work was that reported on census day, and causes of death examined were ischaemic heart disease and injury. Main analyses were Poisson regression models adjusted for socio-demographics. Sensitivity analyses included: additional adjustment for smoking in the 1996 and 2006 cohorts, and bias analysis about non-differential misclassification of cycling vs car use.
Walking (5%) and cycling (3%) to work were uncommon. Compared with people reporting using motor vehicles to travel to work, those cycling had a reduced all-cause mortality (ACM) in the socio-demographic adjusted models RR 0.87 (0.77–0.98). Those walking (0.97, 0.90–1.04) and taking public transport (0.96, 0.88–1.05) had no substantive difference in ACM. No mode of transport was associated with detectable statistically significant reductions in cause-specific mortality. Sensitivity analyses found weaker associations when adjusting for smoking and stronger associations correcting for likely non-differential misclassification of cycling.
This large cohort study supports an association between cycling to work and reduced ACM, but found no association for walking or public-transport use and imprecise cause-specific mortality patterns.
Cycling and walking for transport have been associated (through physical activity, air pollution and injury pathways) with reductions in mortality, although the extent of reductions varies by study.
Commuting using public transport is associated with increases in physical activity, in some studies, but mortality reductions have not been examined previously.
This large cohort study of the whole New Zealand (NZ) working population found commuting by cycling was associated with a 13% reduction in all-cause mortality. Additional adjustment for smoking in cohorts with this measure weakened the association but, conversely, bias analyses about likely non-differential misclassification of cycling vs car use strengthened the association.
We found no significant association between walking or taking public transport to work and reductions in mortality.
We saw no increase in injury deaths in association with walking and cycling, although the NZ transport system at the time of these studies was heavily car-dominated and roads seldom made allowances for pedestrians and cyclists.
Background
Increasing investment in sustainable transport, particularly cycling, is a feature of urban land transport systems in many countries at present. This arises from the need to decarbonize, reduce congestion, decrease air pollution, increase population physical activity (PA) and create more liveable cities.1–3 Modelling studies, with some support from real-world evaluations, report that increased use of walking, cycling and public transport instead of private cars for daily transport should result in health gains from increased population physical activity, reduced air pollution and reduced injury (even allowing for increases in cycling-related injury due to increased uptake).4–6
Accurately quantifying health gain and mortality reduction is important to inform benefit/cost calculations for specific policies, programmes and infrastructure, and to provide evidence to support public debate and political action for policies that can be highly controversial. The associations between walking, cycling and taking public transport and reductions in mortality have been a topic of active research in recent years. However, the magnitude and existence of mortality reductions associated with the different modes of travel, particularly walking and public-transport use, continue to be discussed.7–9
There are two broad ways to quantify the association of transport mode with mortality. First, one can examine directly the mode–mortality association—as we do in this study. This has the advantage of being a direct analysis, but has the disadvantage of requiring large numbers and/or long follow-up accompanied by accurate modality measurement. Second, one can use a two-step process, first quantifying the modality to PA association, then propagating this estimate through a generic association of PA with mortality. This has the advantage of being able to harness a greater number of studies, but the disadvantages of necessary assumptions.
In this study, we used repeated cohorts of the entire working New Zealand (NZ) population over a 15-year period to examine the following questions:
Are cycling, walking and using public transport as modes of travel to work associated with reductions in physical activity-related causes of mortality (e.g. all-cause and ischaemic heart disease) in the NZ working-age population compared with those who drive cars?
Are cycling, walking and using public transport as modes of travel to work associated with different risks of road-traffic injury mortality in the NZ working-age population compared with those who drive cars?
Methods
Population
We used data from the New Zealand Census-Mortality Study. The study probabilistically linked census and mortality records (from Statistics New Zealand and the New Zealand Health Information Service respectively) for the entire NZ population from 1981 to 2011.10,11 This analysis used data from the 1996, 2001 and 2006 census cohorts, which were the cohorts for which travel-to-work information was made available.
Data
The analysis was restricted to people aged 20–64 years old on census night who were in employment and in their usual residence. Each census asked the following question ‘On X date (census day), what was the one main way you travelled to work—that is, the one you used for the greatest distance?’ Responses were categorized into bicycle, walking/jogging, public transport and private motor vehicle. About 1% of people reported uncommon and heterogeneous modes of travel to work, e.g. helicopter. Their results are not reported any further. The private-motor-vehicle category includes car drivers, passengers in cars and those who use motorcycles. Outcomes: Mortality was grouped into all-cause, Ischaemic Heart Disease (IHD) (ICD Codes I20–I25) and road-traffic crash (RTC) (ICD codes V01–V04, V06, V09–V80, V87, V89, V99). Covariates: Data were available on the following covariates: age (grouped into 20–24, 25–34, 35–44, 45–54, 55–64), gender (male/female), ethnicity, NZDep [area deprivation deciles, grouped into 1–6 (least deprived), 7&8, 9&10], highest educational qualification (nil, school, post-school), CPI-adjusted household equivalized income (tertiles), household car access (yes/no), rurality (major/secondary urban and rural/other). Smoking data were available for two of the cohorts (1996 and 2006); these were categorized into current smoker, ex-smoker, never smoked regularly and not specified.
Analysis
A causal diagram was drawn to inform the analysis (see Supplementary Figure 1, available as Supplementary data at IJE online). The three cohorts were analysed together due to small numbers of deaths associated with less common modes of travel. Age and ethnicity standardized rates and rate ratios were calculated using direct age standardization (World Health Organization standard) and the 2001 census distribution of ethnicity. Poisson regression modelling was undertaken adjusting initially for age, cohort and ethnicity, and in the full model for age, sex, cohort, ethnicity, area deprivation, educational qualification, household income, car access and rurality. Results were reported for male and female separately and sex-combined (this regression also included sex as a variable).
Sensitivity analysis
We undertook sensitivity analyses for the 1996 and 2006 cohorts with and without the smoking variable to examine the impact of including smoking on the estimate. We also undertook a sensitivity analysis excluding the first year of follow-up to examine any potential reverse causation (which might result from people in poor health in the first year not partaking in active transport).
Bias analysis
We undertook quantitative bias analysis (QBA) to explore the potential impact of exposure misclassification on the estimate for all-cause mortality (ACM) in cyclists compared with those who drove motor vehicles. Exposure misclassification would come from two sources. The first are people who were usually cyclists (we defined this as people who cycle to work 80% of the time, or four days out of five) not cycling to work on census day, and thus not ticking the cyclist box on the census form. Second are those who are not usually cyclists (i.e. less than four days a week) who happened to cycle on census day and thus were classified as cyclists. Additional error or noise would be from coding errors or errors filling out forms (people accidentally ticking the wrong box). The parameters for these sources of error are laid out in Supplementary 2, available as Supplementary data at IJE online. Once the parameters were established, they were used to estimate a Beta probability distribution for each of the sensitivity and specificity of the exposure measure (census travel-to-work question, just cycling vs car use with other categories put aside for mathematical simplicity) and were then used in probabilistic bias analysis to determine the magnitude and direction of any impact of exposure misclassification on the estimate. Using Monte Carlo simulations, we drew in each iteration from both the bias parameter distribution (i.e. Beta as above) and the distribution of statistical random error (i.e. log normal about the relative risk (RR)) to generate a total uncertainly interval incorporating both systematic (i.e. misclassification bias) and random error (i.e. statistical imprecision). QBA was conducted for European/other men and women aged 45–64 who cycled to work on census day compared with those who drove vehicles (there were insufficient data in other strata). We examined this restricted strata to reduce the impact of confounding on the estimate, thus enabling us to look at the impact of exposure misclassification alone. In addition, the risk of death is higher in those ages, the results more stable and thus the impact of any potential exposure misclassification would be readily interpretable. Finally, we also conducted the QBA among men restricted to never-smokers—the numbers were too small to be able to do this for women. Two thousand simulations were carried out and the results presented as the median (2.5th–97th percentile).
Main and sensitivity analyses were undertaken using SAS Enterprise Guide 7.1 (SAS Institute). Bias analysis used Microsoft Excel 2016.
Results
Table 1 shows the details of the cohorts. Just under 20% of working-age people in employment on census night were excluded from this analysis, as they either did not go to work on census day or worked at home that day. A further 2–4% did not provide useable responses to the question. These exclusions left a final cohort population of just under 80% of the eligible population for each of the three censuses. Additional information for each cohort is available in Supplementary Table 3, available as Supplementary data at IJE online. Person time and standardized mortality rates are available in Supplementary Table 4, available as Supplementary data at IJE online.
Cohort details
| 1996 | 2001 | 2006 | |
|---|---|---|---|
| Population aged 20–64 years in employment and at their usual residence on census night | 1 400 043 | 1 473 963 | 1 687 146 |
| Did not go to work on census day | 112 815 (8.1%) | 135 603 (9.2%) | 140 088 (8.3%) |
| Worked at home on census day | 136 014 (9.7%) | 140 670 (9.5%) | 137 556 (8.2%) |
| Did not answer travel-to-work question or response unidentifiable | 32 997 (2.4%) | 46 074 (3.1%) | 74 679 (4.4%) |
| Final cohort (i.e. left home to go to work on census day and answered the question) | 1 118 217 (79.9%) | 1 151 619 (78.1%) | 1 334 823 (79.1%) |
All numbers in this table have been random rounded to base 3 as per Statistics New Zealand confidentiality protocols.
Table 2 shows the covariates and outcome by mode of travel to work for all cohorts combined. Over 80% of people in NZ travelled to work by car on census day. There were gender differences in mode of travel to work, with 2% of women cycling compared with 4% of men, but more women walking or jogging (7%) compared with men (5%). A higher proportion of younger people cycled, walked or took public transport compared with older people. Ethnic differences in mode of travel to work were minimal, although 9% of people who lived in more deprived communities walked to work compared with 5% of those living in less deprived communities. Rural people were less likely to cycle or take public transport to work than urban, and therefore more likely to drive (91%). Not having access to a car was associated with higher levels of walking, cycling and public-transport use.
Covariates and outcome by mode of travel to work for all cohorts
| Cycling | Walking/jogging | Public transport | Motor vehicle | |
|---|---|---|---|---|
| Gender | ||||
| Males | 68 139 (4%) | 87 114 (5%) | 61 653 (4%) | 1 449 561 (86%) |
| Females | 21 681 (2%) | 101 475 (7%) | 82 029 (6%) | 1 150 641 (84%) |
| Age group | ||||
| 20–24 | 13 263 (4%) | 31 764 (10%) | 26 322 (8%) | 244 125 (77%) |
| 25–34 | 29 805 (4%) | 51 144 (7%) | 43 788 (6%) | 633 720 (83%) |
| 35–44 | 25 962(3%) | 44 463 (5%) | 34 395 (4%) | 759 234 (87%) |
| 45–54 | 14 892 (2%) | 39 552 (5%) | 25 857 (4%) | 644 352 (88%) |
| 55–64 | 5901(2%) | 21 666 (6%) | 13 317 (4%) | 318 774 (88%) |
| Ethnicity | ||||
| Total NZ Mäori | 9774 (3%) | 21 165 (7%) | 13 134 (4%) | 254 034 (85%) |
| Total Pacific | 1869 (2%) | 5925 (5%) | 11 022 (10%) | 89 160 (82%) |
| Total Asian | 1521 (1%) | 11 088 (6%) | 17 388 (10%) | 140 040 (82%) |
| Non-MPA (European/other) | 76 407 (3%) | 150 246 (6%) | 102 498 (4%) | 2 116 167 (86%) |
| Missing | 627 (4%) | 1164 (7%) | 849 (5%) | 13 239 (82%) |
| Educational qualifications | ||||
| No qualifications | 16 743 (3%) | 39 162 (6%) | 19 566 (3%) | 524 868 (87%) |
| School qualifications | 26 676 (3%) | 60 540 (6%) | 49 737 (5%) | 860 424 (86%) |
| Post-school qualifications | 46 398 (3%) | 88 887 (6%) | 74 376 (5%) | 1 214 910 (85%) |
| Income | ||||
| Lowest income | 18 801 (4%) | 46 629 (9%) | 22 242 (4%) | 415 038 (82%) |
| Middle income | 33 813 (3%) | 62 568 (6%) | 44 388 (4%) | 846 642 (85%) |
| Highest income | 37 209 (2%) | 79 392 (5%) | 77 046 (5%) | 1 338 528 (87%) |
| Area deprivation | ||||
| Dep1–6 | 55 239 (3%) | 103 668 (5%) | 95 733 (5%) | 1 806 360 (87%) |
| Dep7&8 | 20 091 (4%) | 48 036 (9%) | 26 673 (5%) | 466 074 (83%) |
| Dep9&10 | 14 490 (4%) | 36 885 (9%) | 21 273 (5%) | 327 768 (81%) |
| Rurality | ||||
| Urban | 85 317 (3%) | 165 834 (6%) | 141 792 (5%) | 2 273 736 (85%) |
| Rural & other | 4494 (1%) | 22 752 (6%) | 1878 (1%) | 325 806 (91%) |
| Car access | ||||
| No | 7953 (9%) | 26 730 (31%) | 20 070 (23%) | 30 138 (35%) |
| Yes | 81 870 (3%) | 161 862 (5%) | 123 612 (4%) | 2 570 070 (87%) |
| Smoking status | ||||
| Smoker | 9477 (2%) | 29 592 (6%) | 19 266 (4%) | 406 815 (87%) |
| Ex-smoker | 12 417 (3%) | 25 629 (6%) | 16 992 (4%) | 403 260 (87%) |
| Never smoked regularly | 38 652 (3%) | 71 970 (6%) | 60 246 (5%) | 945 381 (84%) |
| Not specified | 29 277 (3%) | 61 398 (6%) | 47 178 (5%) | 844 746 (85%) |
| Cause of deathb | ||||
| All-cause mortality | 438 (2%) | 1218 (6%) | 732 (4%) | 16 935 (87%) |
| Ischaemic heart disease | 78 (2%) | 159 (5%) | 111 (4%) | 2769 (88%) |
| RTC | 36 (4%) | 69 (7%) | 24 (2%) | 864 (86%) |
1996 and 2006 only had this question. 2001 coded as not specified.
Weighted for linkage bias. All numbers in this table have been random rounded to base 3 as per Statistics New Zealand confidentiality protocols.
RTC, road traffic crash; Dep, deprivation decile, with 1–6 being the least deprived.
Table 3 shows the regression modelling looking at mortality by mode of travel to work. Sex-combined results are presented here (sex-specific findings are available in Supplementary Table 5, available as Supplementary data at IJE online). Men and women who cycled to work had lower ACM in the fully adjusted model than those who drove [RR 0.87 95% confidence interval (CI): 0.77–0.98]. Cause-specific-mortality results had the a priori expected pattern of a protective association of cycling and walking/jogging with IHD mortality, but the confidence intervals were wide. However, there were no obvious associations with road-traffic crash. For men and women who walked or took public transport to work on census day, there were no consistent patterns of reduced or increased mortality compared with those who drove cars in the fully adjusted model. Road-traffic-injury deaths rates did appear to be lower (but not significantly so in the fully adjusted model) for men and women who took public transport to work (RR 0.62 95% CI: 0.37–1.04).
Regression modelling mode of transport on census day and all-cause mortality, sex-combined
| Transport mode | Deaths (n) | Age, sex, ethnicity and cohort adjusted rate ratio (95% CI) | Multivariablea adjusted rate ratio (95% CI) |
|---|---|---|---|
| All-cause mortality | |||
| Cycling | 417 | 0.95 (0.85–1.07) | 0.87 (0.77–0.98) |
| Walking/jogging | 1080 | 1.13 (1.05–1.21) | 0.97 (0.90–1.04) |
| Public transport | 678 | 1.03 (0.94–1.12) | 0.96 (0.88–1.05) |
| Motor vehicle | 15 249 | Ref | Ref |
| Ischaemic heart disease | |||
| Cycling | 75 | 1.02 (0.77–1.34) | 0.90 (0.68–1.19) |
| Walking/jogging | 132 | 0.96 (0.78–1.17) | 0.81 (0.66–1.00) |
| Public transport | 102 | 1.17 (0.93–1.47) | 1.10 (0.87–1.39) |
| Motor vehicle | 2484 | Ref | Ref |
| Road-traffic crash | |||
| Cycling | 36 | 0.97 (0.63–1.51) | 1.01 (0.65–1.57) |
| Walking/jogging | 69 | 1.15 (0.84–1.58) | 1.09 (0.79–1.51) |
| Public transport | 24 | 0.53 (0.32–0.87) | 0.62 (0.37–1.04) |
| Motor vehicle | 843 | Ref | Ref |
Adjusted for age, sex, ethnicity, cohort, area of deprivation, educational qualification, household income, car access and rurality. All numbers in this table have been random rounded to base 3 as per Statistics New Zealand confidentiality protocols.
We examined the impact of including smoking in the model (see Supplementary Table 6, available as Supplementary data at IJE online). For the 1996 and 2006 cohorts, the estimates mostly moved towards the null when smoking was included. For example, the IHD mortality rate ratio in people who cycled to work moved from 0.85 (95% CI: 0.62–1.18) to 0.95 (95% CI: 0.69–1.31). Deleting the first year of follow-up, a test of reverse causation did not consistently alter the direction of the point estimates (Supplementary Table 7, available as Supplementary data at IJE online).
Finally, Figure 1 (and Supplementary Table 8, available as Supplementary data at IJE online) shows the results of the bias analysis examining the impact of likely non-differential exposure misclassification of cycling compared with travelling by private motor vehicle for European/other ethnicity aged 45–64, by gender and smoking status (for men). The first ‘row’ of results are the crude RRs and 95% CIs, and the second ‘row’ the adjusted estimate with a total uncertainty interval (i.e. both random and systematic error). Adjustment for exposure misclassification shifted relative risks away from the null by around a quarter for men. The female relative risk moved from 0.97 to 0.91, although it retained wide uncertainty intervals that crossed the null.
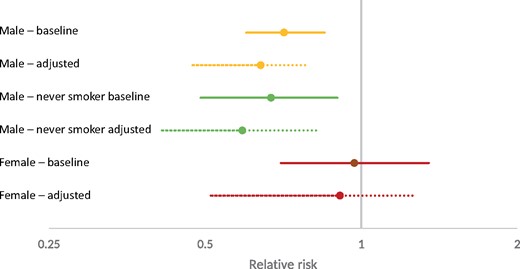
All-cause mortality relative-risks baseline and adjusted for exposure misclassification. Relative risk in log scale. Adjusted estimates include both random error plus propagated uncertainty about the sensitivity and specificity bias parameters in the Monte Carlo simulation. Never-smoking women are not reported due to small numbers.
Discussion
Main findings
ACM: Cycling to work was associated with a 13% (95% CI: 2–23) reduction in ACM in men and women for the main analysis of all cohorts, adjusted for a range of socio-demographic factors. However, when the two cohorts in which tobacco smoking was assessed were analysed, the ACM rate ratio adjusted for socio-demographic factors of 0.82 (95% CI: 0.71–0.94) shifted a third of the way to the null after additional adjustment for smoking (0.88, 95% CI: 0.77–1.01). Conversely, adjustment for likely misclassification of cycling vs motor-vehicle use in quantitative bias analyses drives the estimates away from the null by roughly the same amount as confounding by tobacco drives it to the null.
Cause-specific mortality: Regarding IHD, rates were 10–20% lower among cyclists and pedestrians, compared with motor-vehicle users in the total cohort adjusted for socio-demographics—but with wide 95% CIs including null. As expected, these modest protective effects reduced to the null after adjusting for smoking in the cohorts with smoking data—with 95% CIs comfortably including the null. Road-traffic-crash mortality was little different between cyclists, pedestrians and motor-vehicle users, but lower for public-transport users—albeit with 95% CI traversing the null.
Best summary: Our results are consistent with a modestly lower mortality rate for cyclists compared with motor-vehicle users, but are far from definitive.
Strengths and weaknesses
This study used data from about 3.5 million working people in NZ over a 15-year period, with over 15 million person-years of follow-up. This represents one of the largest cohort studies, if not the largest, examining the association between mode of travel to work and mortality outcomes. We have a cohort comprising 80% of the working-age population of NZ over a 15-year period, making it highly representative. Relatively unusually, we were able to examine associations for public transport as well as cycling and walking.
We sought evidence for reverse causation in our modelling, but there was little impact of removing the first year of follow-up from the analysis. Despite the size of this study, we were unable to look at the full range of potentially relevant mortality outcomes (e.g. deaths due to cancers known to be associated with PA, such as breast and colon cancer) as numbers were too small. This is due to the relative youthfulness of the cohort, a likely healthy worker effect and the high survival of some cancers (e.g. breast cancer).
The main sources of error in this study are likely to come from residual confounding and exposure misclassification. The remainder of this section discusses these in more detail.
In this study, we were unable to adjust for a number of potentially important confounders including PA from sources other than commuting, diet and weight, although these are probably captured in part by correlation with socio-economic position variables in the regression models. We also did not have information about pre-existing health conditions that might act as confounders in the association between mode of transport and mortality—although this was addressed indirectly by excluding deaths in the first year.
As the census question is only about travel on one day of the year, there is also potential for exposure misclassification, whereby people who cycle regularly are missed on census day or people who cycle irregularly are counted on census day. The exposure measure also provides no indication of the amount or intensity of the PA associated with commuting. So, e.g., people who live in the inner city and walk 200 m to work are in the same category as those who walk for 30 min to and from work briskly up and down a hill. In addition, the question asks about the mode of travel with the greatest distance, which would preferentially bias towards non-active travel modes if, e.g., a person both walks and takes public transport/car. Finally, the exposure also occurs at one point in time, so it is difficult to know whether this reflects more sustained travel patterns.
We attempted to quantify the impact of residual confounding and exposure misclassification on the central estimates. The sensitivity analysis of cohorts with smoking data available suggests that this residual confounding would pull the estimate towards the null. Our bias analysis, based on a range of plausible sensitivity and specificity estimates of the exposure measurement, suggests that this source of error is likely to pull the estimate further away from the null, i.e. the results of this study represent an underestimate of the true protective effect of cycling on ACM. As a result, it is plausible that our main results might roughly reflect what a ‘better’ study with more thorough confounder and exposure assessment might observe—although one must be cautious about making inference on the basis of likely cancelling errors. Nevertheless, we cautiously conclude that our study offers some empirical support that cycling to work is indeed associated with a modest reduction in all-cause mortality—but it is far from definitive.
Implications of research
Our research adds to a body of evidence in support of an association between cycling and reduced mortality,7,8,12,13 although this association is not a universal finding.14,15 The magnitude of association we reported was more modest than that in some other studies,8 but is similar to the 10% reduction in ACM calculated in a 2014 meta-analysis of research published up to that date.7 In addition, our cohort was more representative than many other cohorts, so this may reflect a plausible population impact.
Our study did not show any statistically significant associations between commuting by walking and reductions in mortality, although the associations were in the direction of a reducing risk. These findings are similar to those of the UK Biobank cohort,8 in which there was little evidence of an association between ACM and walking, and a stronger association with cardiovascular disease was apparent but with wide confidence intervals that included the null. Other literature is supportive of an association between commuting by walking and reduced mortality, e.g. in one systematic review, it was estimated that a standard dose of 675 metabolic equivalents (METs) minutes per week walking was associated with a 10–11% reduction in ACM.7 Other literature that combines transport-related PA into a single category supports an association between more active modes and reduced mortality.9,16,17
The lack of association between public transport and mortality in our paper is perhaps not surprising. The ‘dose’ of PA associated with public-transport use is likely be small, making it unlikely to observe an impact on physical-activity-related outcomes. One other study examined the association between health outcomes and those who walk and take another mode in their commute (this other mode would either be a car or public transport). The authors did not find a reduction in all-cause, cardiovascular or cancer mortality.8 Whereas other research suggests an association between public transport and increased PA,18–20 our results are consistent with NZ research that looked at the mode of travel to the main activity and the likelihood of meeting the NZ PA guidelines. In contrast to those who cycled or walked to their main activity [odds ratio (OR): 1.76; 95% CI: 1.26–2.47], people who took public transport were no more likely to meet guidelines than those who travelled by private motor vehicle (OR: 1.15; 95% CI: 0.80–1.65).21 It is plausible that associations between public transport and PA levels and health outcomes are context-specific.
Policy and practice implications
Our findings, in combination with other research, lend support for policies and infrastructure to increase levels of cycle commuting as a population-level intervention to reduce ACM. Increasing cycling for commuting to work, in a low-cycling country such as NZ, will require a suite of policies directed at both transport and urban form, e.g. increasing housing density, encouraging mixed land use and implementing cycling networks.1 To be effective, a range of both ‘carrot’ and ‘stick’ approaches (encouraging active modes and discouraging cars, respectively) will be required to facilitate a change in mobility culture and significant shift in transport-mode distribution.22–24
Whereas our study did not find evidence of an association between commuting to work by walking or taking public transport and a reduction in mortality, there are other reasons to promote these policies. Walking to work has physical-activity-related health benefits other than mortality reduction, including prevention of incident cardiovascular disease and diabetes.8,25,26 In addition, a safety-in-numbers effect applies for walking as well as cycling; hence, if we want to improve walking safety (and thus popularity), we should encourage more walking.27,28 Local and international modelling also suggests increasing the use of public transport is an important strategy to reduce transport-related greenhouse gas emissions and, possibly, transport-related injury.4,29 Walking and public transport are an integral part of the transformation of our cities and transport systems to support a sustainable healthy low-carbon future.30
Conclusion
This study has drawn on a unique data set to investigate the relation between commuting mode and mortality in the entire NZ working population. In the study period, the NZ transport system was heavily car-dominated: 85% of trips to work were made by private motor vehicle. We were unable to find evidence of an association between walking or taking public transport to work and mortality, although we observed that cycling to work was associated with a modest reduction in ACM. The restriction to persons under 65 and the bias towards healthy individuals in the working population may have reduced the power of the research to identify associations with cause-specific mortality. Nevertheless, our findings, in the context of the wider literature, have implications for policy.
Funding
The authors declare no funding sources for this work.
Acknowledgements
Ethics approval for the New Zealand Census-Mortality Study was provided by the Central Regional Ethics Committee (reference number WGT/04/10/093). Access to the data used in this study was provided by Statistics New Zealand under conditions designed to give effect to the security and confidentiality provisions of the Statistics Act 1975. The results presented in this study are the work of the author, not Statistics NZ.
Conflict of interest: None declared.

