
Sustainable Water Management and the 2030 Agenda: Comparing Rain Forest Watersheds in Canada and Brazil by Applying an Innovative Sustainability Indicator System
 and
and
Abstract
:1. Introduction
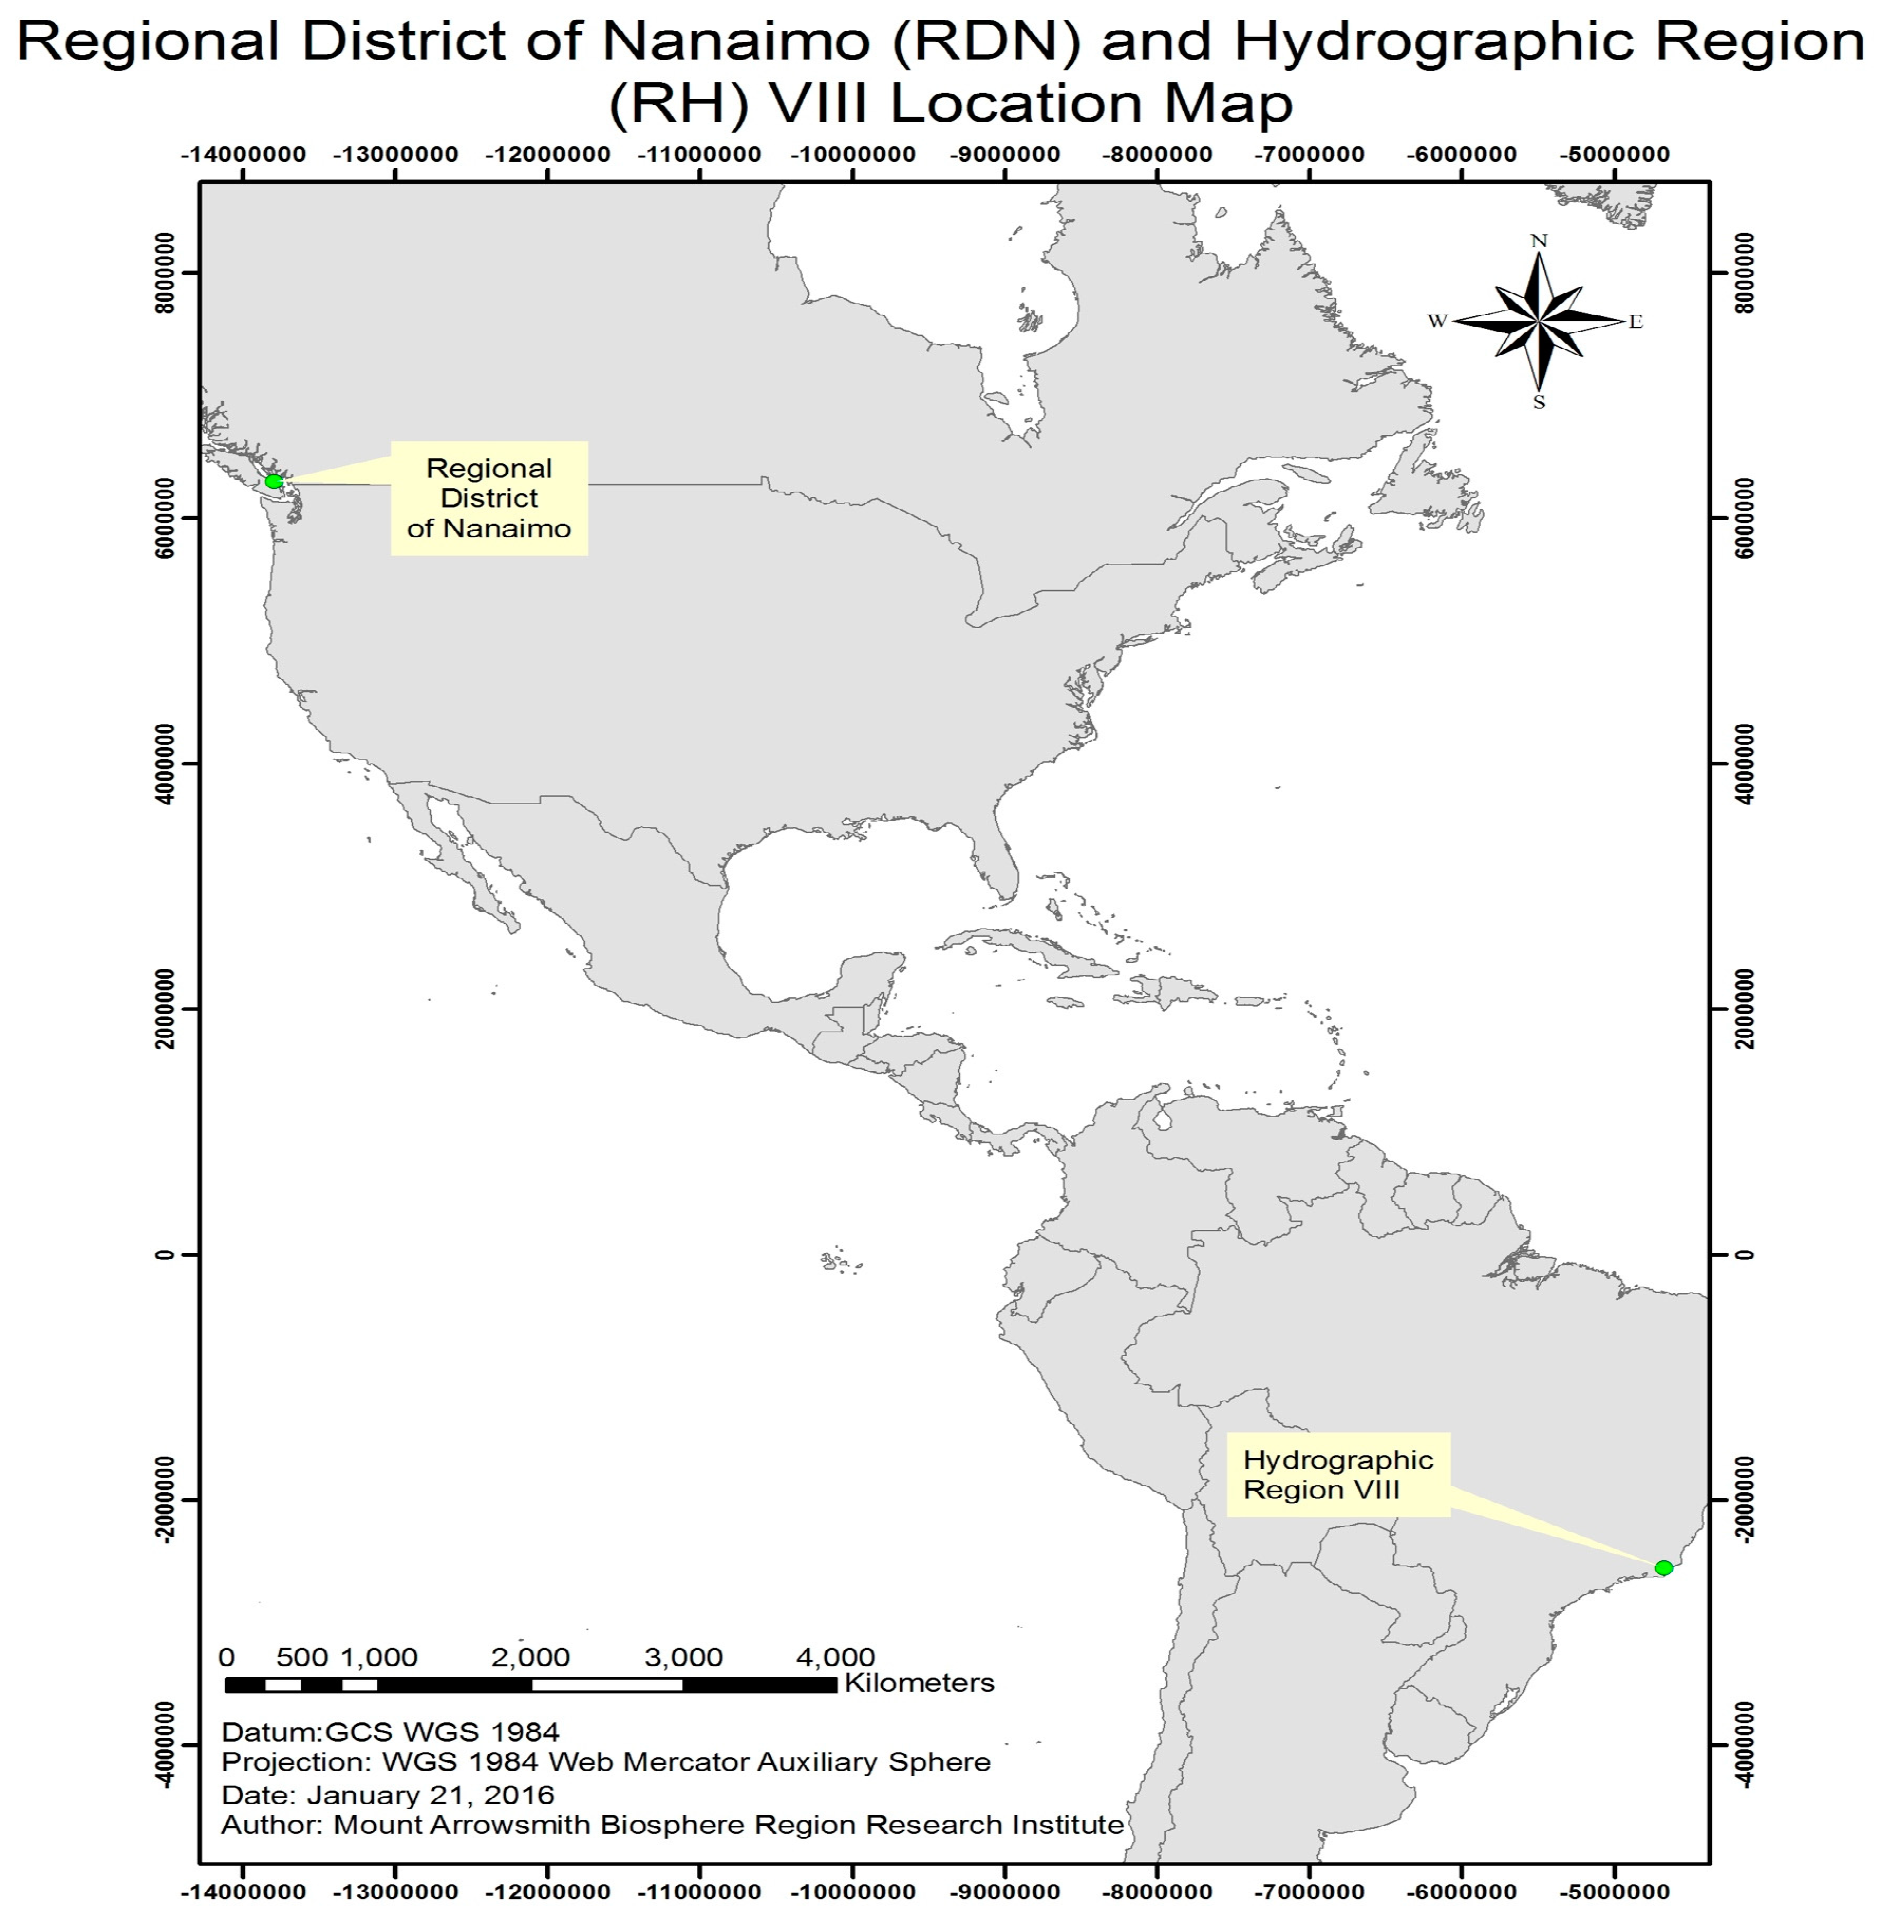
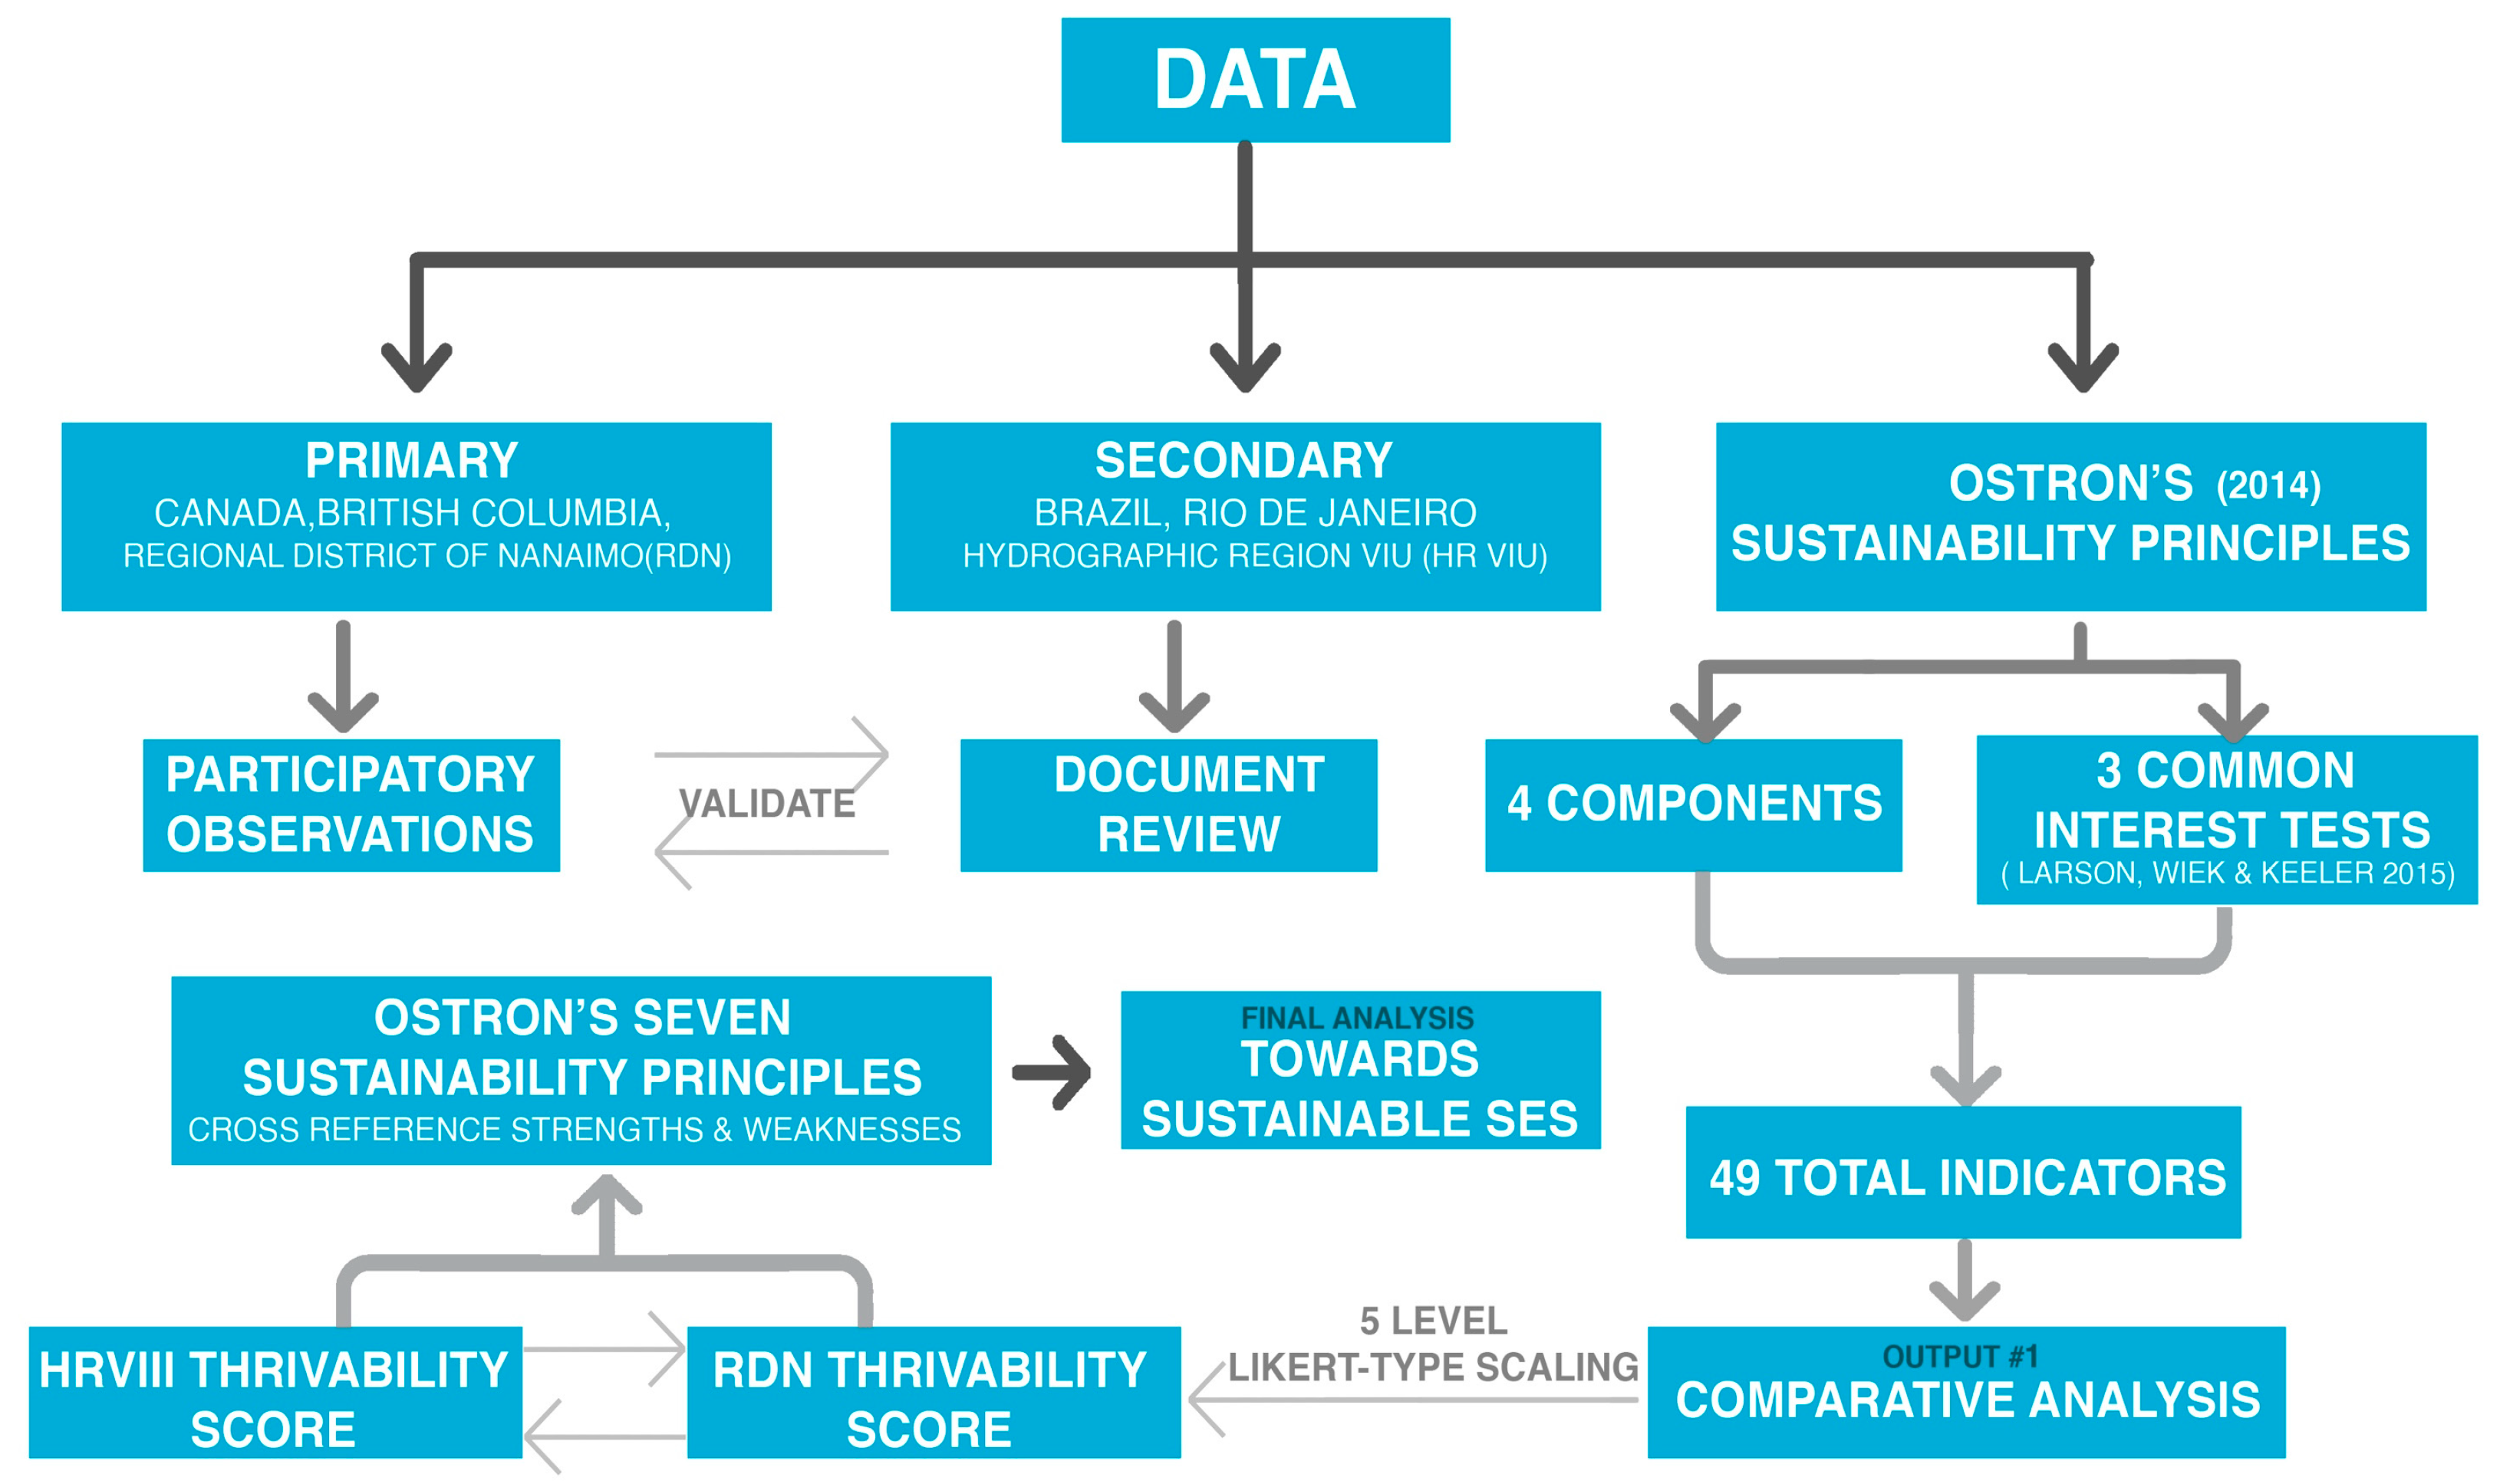
2. Materials and Methods
3. Results and Discussion
4. Conclusions
Author Contributions
Funding
Institutional Review Board Statement
Conflicts of Interest
References
- Ruddiman, W.F. The Anthropocene. Annu. Rev. Earth Planet. Sci. 2013, 41, 45–68. [Google Scholar] [CrossRef]
- Adler, J.H.; Blomqvist, L.; Fleck, R.K.; Hanssen, F.A.; Huffman, J.L.; Pennington, M.; Regan, S.; Simonds, G.; Simpson, R.D. Dynamic Environmentalism and Adaptive Management: Legal Obstacles and Opportunities. In Environmental Policy in the Anthropocene; PERC—Property and Environment Research Center: Bozeman, MT, USA, 2016; pp. 65–92. [Google Scholar]
- Birman, F.; Abbott, K.; Andresen, S.; Bäckstrand, K.; Bernstein, S.; Betsill, M.M.; Bulkeley, H.; Cashore, B.; Clapp, J.; Folke, C. Transforming governance and institutions for global sustainability: Key insights from the Earth System Governance Project. Curr. Opin. Environ. Sustain. 2012, 4, 51–60. [Google Scholar] [CrossRef]
- Norstrom, A.V.; Dannenberg, A.; McCarney, G.; Milkoreit, M.; Diekert, F.; Engström, G.; Fishman, R.; Gars, J.; Kyriakopoolou, E.; Manoussi, V. Three Necessary Conditions for Establishing Effective Sustainable Development Goals in the Anthropocene. Ecol. Soc. 2014, 19, 8. Available online: https://www.jstor.org/stable/26269630 (accessed on 2 May 2022). [CrossRef]
- Wackernagel, M.; Hanscom, L.; Lin, D. Making the sustainable development goals consistent with sustainability. Front. Energy Res. 2017, 5, 18. [Google Scholar] [CrossRef]
- Guijarro, F.; Poyatos, J. Designing a sustainable development goal index through a goal programming model: The case of EU-28 countries. Sustainability 2018, 10, 3167. [Google Scholar] [CrossRef]
- Ramos, T.B. Sustainability assessment: Exploring the frontiers and paradigms of indicator approaches. Sustainability 2019, 11, 824. [Google Scholar] [CrossRef]
- UN. The Sustainable Development Goals Report 2020. United Nations Publication Issued by the Department of Economic and Social Affairs. 2020. Available online: https://unstats.un.org/sdgs/report/2020/The-Sustainable-Development-Goals-Report-2020.pdf (accessed on 6 June 2021).
- Pires, A.; Morato, J.; Peixoto, H.; Botero, V.; Zuluaga, L.; Figueroa, A. Sustainability assessment of indicators for integrated water resources management. Sci. Total Environ. 2017, 578, 139–147. [Google Scholar] [CrossRef]
- Janoušková, S.; Hák, T.; Moldan, B. Global SDGs assessments: Helping or confusing indicators? Sustainability 2018, 10, 1540. [Google Scholar] [CrossRef]
- Costanza, R.; Daly, L.; Fioramonti, L.; Giovannini, E.; Kubiszewski, I.; Mortensen, L.F.; Pickett, K.E.; Ragnarsdottir, K.V.; De Vogli, R.; Wilkinson, R. Modelling and measuring sustainable wellbeing in connection with the UN sustainable development goals. Ecol. Econ. 2016, 130, 350–355. [Google Scholar] [CrossRef]
- Nilsson, M.; Chisholm, E.; Griggs, D.; Howden-Chapman, P.; McCollum, D.; Messerli, P.; Neumann, B.; Stevance, A.; Visbeck, N.; Stafford-Smith, M. Mapping interactions between the sustainable development goals: Lessons learned and ways forward. Sustain. Sci. 2018, 13, 1489–1503. [Google Scholar] [CrossRef]
- Weitz, N.; Carlsen, H.; Nilsson, M.; Skanberg, K. Towards systemic and contextual priority setting for implementing the 2030 agenda. Sustain. Sci. 2018, 13, 531–548. [Google Scholar] [CrossRef] [PubMed]
- Hutton, C.W.; Nicholls, R.J.; Lázár, A.N.; Chapman, A.; Schaafsma, M.; Salehin, M. Potential trade-offs between the sustainable development goals in coastal bangladesh. Sustainability 2018, 10, 1108. [Google Scholar] [CrossRef]
- Mainali, B.; Luukkanen, J.; Silveira, S.; Kaivo-oja, J. Evaluating synergies and trade-offs among sustainable development goals (SDGs): Explorative analyses of development paths in south asia and sub-saharan africa. Sustainability 2018, 10, 815. [Google Scholar] [CrossRef]
- Engström, R.; Destouni, G.; Howells, M.; Ramaswamy, V.; Rogner, H.; Bazilian, M. Cross-scale water and land impacts of local climate and energy Policy—A local swedish analysis of selected SDG interactions. Sustainability 2019, 11, 1847. [Google Scholar] [CrossRef]
- Cook, D.; Saviolidis, N.; Davidsdottir, B.; Johannsdottir, L.; Ólafsson, S. Synergies and trade-offs in the sustainable development Goals—The implications of the icelandic tourism sector. Sustainability 2019, 11, 4223. [Google Scholar] [CrossRef]
- Huan, Y.; Li, H.; Liang, T. A new method for the quantitative assessment of sustainable development goals (SDGs) and a case study on central asia. Sustainability 2019, 11, 3504. [Google Scholar] [CrossRef]
- Ament, J.M.; Freeman, R.; Carbone, C.; Vassall, A.; Watts, C. An empirical analysis of synergies and tradeoffs between sustainable development goals. Sustainability 2020, 12, 8424. [Google Scholar] [CrossRef]
- Hegre, H.; Petrova, K.; Uexkull, N. Synergies and trade-offs in reaching the sustainable development goals. Sustainability 2020, 12, 8729. [Google Scholar] [CrossRef]
- Ferreira, M.I.P.; Shaw, P.; Sakaki, G.; Alexander, T. Thrivability Appraisals: A Tool for Supporting Decision-making Processes in Integrated Environmental Management. Int. J. Sustain. Policy Pract. 2017, 13, 19–36. [Google Scholar] [CrossRef]
- Mafort, A.V.L.; Rodrigues, A.C.C.; Ferreira, M.I.P.; Neto, R.S. Sustentabilidade de sistemas socioambientais: Comparativo entre a Região Hidrográfica VIII do estado do Rio de Janeiro e sua zona costeira. Espaço E Econ. 2019, 8. [Google Scholar] [CrossRef]
- Machado, R.P.; Donnini, J.G.B.; Ferreira, M.I.P. 2030 Agenda and sustainable water management: Application of thrivability appraisal methodology to River Una watershed, Rio de Janeiro, Brasil. In Proceedings of the VIIIth Environmental Studies Meeting (VIII REA), Gramado, Brazil; 2018; p. 9REA1522. Available online: https://pt.slideshare.net/anielycosta/anais-da-9-reunio-de-estudos-ambientais/ (accessed on 20 January 2022).
- Ferreira, M.I.P. Água Como fio Condutor dos ODS: Avaliando o Bem-Estar Com um Sistema Holístico de Indicadores de Sustentabilidade Aplicados à Gestão de Recursos Hídricos; ENAP—Brazilian School of Public Administration: Brasília, Brazil, 2022. Available online: https://repositorio.enap.gov.br/handle/1/7249/ (accessed on 2 May 2022).
- Reed, M.G. Conservation (In)Action: Renewing the Relevance of UNESCO Biosphere Reserves. Conserv. Lett. 2016, 9, 448–456. [Google Scholar] [CrossRef]
- Statistics Canada. Census Profile, 2021 Census of Polulation: Profile Table. 2021. Available online: https://www12.statcan.gc.ca/census-recensement/2021/dp-pd/prof/details/page.cfm?Lang=E&SearchText=nanaimo&DGUIDlist=2021A00035921&GENDERlist=1&STATISTIClist=1&HEADERlist=0 (accessed on 2 May 2022).
- Bhaduri, A.; Bogardi, J.; Siddiqi, A.; Voigt, H.; Vörösmarty, C.; Pahl-Wostl, C.; Bunn, S.E.; Shrivastava, P.; Lawford, R.; Foster, S.; et al. Achieving sustainable development goals from a water perspective. Front. Environ. Sci. 2016, 4. [Google Scholar] [CrossRef]
- McCracken, M.; Meyer, C. Monitoring of transboundary water cooperation: Review of sustainable development goal indicator 6.5.2 methodology. J. Hydrol. 2018, 563, 1–12. [Google Scholar] [CrossRef]
- Benson, D.; Gain, A.K.; Giupponi, C. Moving beyond water centricity? conceptualizing integrated water resources management for implementing sustainable development goals. Sustain. Sci. 2019, 15, 671–681. [Google Scholar] [CrossRef]
- IPEA—Instituto de Pesquisa Econômica Aplicada. Cadernos ODS: ODS 6—Assegurar Disponibilidade e Gestão Sustentável da água e Saneamento Para Todas e Todos; IPEA: Brasília, Brazil, 2019. Available online: https://www.ipea.gov.br/portal/images/stories/PDFs/livros/livros/190524_cadernos_ODS_objetivo_6.pdf/ (accessed on 31 July 2022).
- Bennich, T.; Weitz, N.; Carlson, H. Deciphering the scientific literature on SDG interactions: A review and reading guide. Sci. Total Environ. 2020, 728, 138405. [Google Scholar] [CrossRef]
- Dijk, M.; Kraker, J.; van Zeijl-Rozema, A.; van Lente, H.; Beumer, C.; Beemsterboer, S.; Valkering, P. Sustainability assessment as problem structuring: Three typical ways. Sustain. Sci. 2017, 12, 305–317. [Google Scholar] [CrossRef]
- Vanham, D.; Hoekstra, A.Y.; Wada, Y.; Bouraoui, F.; De Roo, A.; Mekonnen, M.M.; van de Bund, W.J.; Batelaan, O.; Pavelic, P.; Bastiaanssen, W.G.M.; et al. Physical water scarcity metrics for monitoring progress towards SDG target 6.4: An evaluation of indicator 6.4.2 “Level of water stress”. Sci. Total Environ. 2018, 613–614, 218–232. [Google Scholar] [CrossRef]
- Fehri, R.; Khlifi, S.; Vanclooster, M. Disaggregating SDG-6 water stress indicator at different spatial and temporal scales in tunisia. Sci. Total Environ. 2019, 694, 133766. [Google Scholar] [CrossRef]
- Ashford, N.A.; Hall, R.P.; Arango-Quiroga, J.; Metaxas, K.A.; Showalter, A.L. Addressing inequality: The first step beyond COVID-19 and towards sustainability. Sustainability 2020, 12, 5404. [Google Scholar] [CrossRef]
- Apostolaki, S.; Koundouri, P.; Pittis, N. Using a systemic approach to address the requirement for integrated water resource management within the water framework directive. Sci. Total Environ. 2019, 679, 70–79. [Google Scholar] [CrossRef]
- Moggi, S.; Pierce, P.; Bernardi, N. From sustainability to thrivability: A novel framework for entrepreneurial ecosystems. Int. Entrep. Manag. J. 2022, 18, 829–853. [Google Scholar] [CrossRef]
- Ostrom, E. General framework for analyzing sustainability of social-ecological systems. Sci. (Am. Assoc. Adv. Sci.) 2009, 325, 419–422. [Google Scholar] [CrossRef] [PubMed]
- Larson, K.L.; Wiek, A.; Keeler, L.W. A comprehensive sustainability appraisal of water governance in phoenix, AZ. J. Environ. Manag. 2013, 116, 58–71. [Google Scholar] [CrossRef] [PubMed]
- Clark, S.G.; Vernom, M.E. Governance Challenges in Joint Inter-jurisdictional Management: The Grand Teton National Park, Wyoming, Elk Case. Environ. Manag. 2015, 56, 286–299. [Google Scholar] [CrossRef] [PubMed]
- Ferreira, M.I.P.; Shaw, P.; Sakaki, G.K.; Alexander, T.; Donnini, J.G.B.; Rego, V.V.B.S. Collaborative governance and watershed management in biosphere reserves in brazil and canada. Rev. Ambiente Água 2018, 13, 1E–11E. [Google Scholar] [CrossRef]
- Munkhsuld, E.; Ochir, A.; Koop, S.; van Leeuwen, K.; Batbold, T. Application of the City Blueprint Approach in Landlocked Asian Countries: A Case Study of Ulaanbaatar. Water 2020, 12, 199. [Google Scholar] [CrossRef]
- Rana, S.; Ávila-García, D.; Dib, V.; Familia, L.; Gerhardinger, L.C.; Martin, E.; Martins, P.I.; Pompeu, J.; Selomane, O.; Tauli, J.I.; et al. The voices of youth in envisioning positive futures for nature and people. Ecosyst. People 2020, 16, 326–344. [Google Scholar] [CrossRef]
- Ott, K. Institutionalizing strong sustainability: A rawlsian perspective. Sustainability 2014, 6, 894–912. [Google Scholar] [CrossRef]
- Newman, B.; Ott, K.; Kenchington, R. Strong sustainability in coastal areas: A conceptual interpretation of SDG 14. Sustain. Sci. 2017, 12, 1019–1035. [Google Scholar] [CrossRef]
- Mori, K.; Christodoulou, A. Review of sustainability indices and indicators: Towards a new city sustainability index (CSI). Environ. Impact Assess. Rev. 2012, 32, 94–106. [Google Scholar] [CrossRef]
- Purvis, B.; Mao, Y.; Robinson, D. Three pillars of sustainability: In search of conceptual origins. Sustain. Sci. 2018, 14, 681–695. [Google Scholar] [CrossRef]
- Bell, S.; Morse, S. Sustainability Indicators: Measuring the Immeasurable, 2nd ed.; Earthscan: New York, NY, USA, 2008; p. 251. [Google Scholar]
- Marques, L. Capitalismo e Colapso Ambiental, 1st ed.; Editora Unicamp: São Paulo, Brasil, 2018. [Google Scholar]
- Bell, S.; Morse, S. Sustainability indicators past and present: What next? Sustainability 2018, 10, 1688. [Google Scholar] [CrossRef]
- Böhringer, C.; Jochem, P.E.P. Measuring the immeasurable—A survey of sustainability indices. Ecol. Econ. 2007, 63, 1–8. [Google Scholar] [CrossRef]
- Sullivan, C.; Meigh, J.; Lawrence, P. Application of the water poverty index at different scales: A cautionary tale: In memory of jeremy meigh who gave his life’s work to the improvement of peoples lives. Water Int. 2006, 31, 412–426. [Google Scholar] [CrossRef]
- Sullivan, C.; Meigh, J. Targeting attention on local vulnerabilities using an integrated index approach: The example of the climate vulnerability index. Water Sci. Technol. 2005, 51, 69–78. [Google Scholar] [CrossRef] [PubMed]
- Vörösmarty, C.J.; Douglas, E.M.; Green, P.A.; Revenga, C. Geospatial indicators of emerging water stress: An application to africa. Ambio 2005, 34, 230–236. [Google Scholar] [CrossRef]
- Huang, S.; Feng, Q.; Lu, Z.; Wen, X.; Deo, R.C. Trend analysis of water poverty index for assessment of water stress and water management polices: A case study in the hexi corridor, china. Sustainability 2017, 9, 756. [Google Scholar] [CrossRef]
- Guimarães, É.; Ferreira, M.I. Na contramão dos objetivos do desenvolvimento sustentável: Avaliação da pobreza hídrica na região estuarina do rio macaé, Macaé/RJ. Saúde E Soc. 2020, 29. [Google Scholar] [CrossRef]
- Pandey, R.; Jha, S. Climate vulnerability index—Measure of climate change vulnerability to communities: A case of rural lower himalaya, India. Mitig. Adapt. Strateg. Glob. Chang. 2011, 17, 487–506. [Google Scholar] [CrossRef]
- Zanetti, V.; Junior, W.C.S.; Freitas, D.M. A climate change vulnerability index and case study in a brazilian coastal city. Sustainability 2016, 8, 811. [Google Scholar] [CrossRef]
- UN-Water. The United Nations World Water Development Report 4: Managing Water under Uncertainty and Risk; World Water Assessment Programme (WWAP): Paris, France, 2012; Chapter 6: From Raw Data to Informed Decisions; pp. 158–173. Available online: https://unesdoc.unesco.org/ark:/48223/pf0000215644 (accessed on 6 June 2021).
- Simons, G.W.H.; Bastiaanssen, W.G.M.; Immerzeel, W.W. Water reuse in river basins with multiple users: A literature review. J. Hydrol. 2015, 522, 558–571. [Google Scholar] [CrossRef]
- Schimidt-Traub, G.; Karoubi, E.M.; Espey, J. Indicators and a Monitoring Framework for the Sustainable Development Goals: Launching a Data Revolution for the SDGs. 2015. Available online: https://resources.unsdsn.org/indicators-and-a-monitoring-framework-for-sustainable-development-goals-launching-a-data-revolution-for-the-sdgs/ (accessed on 11 November 2021).
- Lafortune, G.; Fuller, G.; Schmidt-Traub, G.; Kroll, C. How is progress towards the sustainable development goals measured? comparing four approaches for the EU. Sustainability 2020, 12, 7675. [Google Scholar] [CrossRef]
- Sachs, J.; Kroll, C.; Schmidt-Traub, G.; Lafortune, G.; Fuller, G. Sustainable Development Report 2019: Transformation to Achieve the Sustainable Development Goals. 2019. Available online: https://www.sdgindex.org/reports/sustainable-development-report-2019/ (accessed on 20 April 2022).
- Horan, D. National baselines for integrated implementation of an environmental sustainable development goal assessed in a new integrated SDG index. Sustainability 2020, 12, 6955. [Google Scholar] [CrossRef]
- Horan, D. Enabling integrated policymaking with the sustainable development goals: An application to ireland. Sustainability 2020, 12, 7800. [Google Scholar] [CrossRef]
- Ionescu, G.H.; Firoiu, D.; Tanasie, A.; Sorin, T.; Pirvu, R.; Manta, A. Assessing the Achievement of the SDG Targets for Health and Well-Being at EU Level by 2030. Sustainability 2020, 12, 5829. [Google Scholar] [CrossRef]
- Boto-Álvarez, A.; García-Fernández, R. Implementation of the 2030 agenda sustainable development goals in spain. Sustainability 2020, 12, 2546. [Google Scholar] [CrossRef]
- Schmidt-Traub, G.; Kroll, C.; Teksoz, K.; Durand-Delacre, D.; Sachs, J.D. National baselines for the Sustainable Development Goals assessed in the SDG Index and Dashboards. Nat. Geosci. 2017, 10, 547–556. [Google Scholar] [CrossRef]
- Diaz-Sarachaga, J.M.; Jato-Espino, D.; Castro-Fresno, D. Is the sustainable development goals (SDG) index an adequate framework to measure the progress of the 2030 agenda? Sustain. Dev. 2018, 26, 663–671. [Google Scholar] [CrossRef]
- Kanie, N.; Griggs, D.; Young, O.; Waddell, S.; Shrivastava, P.; Haas, P.M.; Broadgate, W.; Gaffney, O.; Kőrösi, C. Rules to goals: Emergence of new governance strategies for sustainable development: Governance for global sustainability is undergoing a major transformation from rule-based to goal-based. but with no compliance measures, success will require an unprecedented level of coherency of action founded on new and reformed institutions nationally and internationally. Sustain. Sci. 2019, 14, 1745–1749. [Google Scholar] [CrossRef]
- Hall, R.; Ranganathan, S.; Kumar, R. A general micro-level modeling approach to analyzing interconnected SDGs: Achieving SDG 6 and more through multiple-use water services (MUS). Sustainability 2017, 9, 314. [Google Scholar] [CrossRef]
- Hering, J. Managing the ‘Monitoring imperative’ in the context of SDG target 6.3 on water quality and wastewater. Sustainability 2017, 9, 1572. [Google Scholar] [CrossRef]
- Burford, G.; Hoover, E.; Velasco, I.; Janouskova, S.; Jimenez, A.; Piggot, G.; Podger, D.; Harder, M.K. Bringing the “Missing pillar” into sustainable development goals: Towards intersubjective values-based indicators. Sustainability 2013, 5, 3035–3059. [Google Scholar] [CrossRef]
- Waas, T.; Hugé, J.; Block, T.; Wright, T.; Benitez-Capistros, F.; Verbruggen, A. Sustainability assessment and indicators: Tools in a decision-making strategy for sustainable development. Sustainability 2014, 6, 5512–5534. [Google Scholar] [CrossRef]
- Dizdaroglu, D. The role of indicator-based sustainability assessment in policy and the decision-making process: A review and outlook. Sustainability 2017, 9, 1018. [Google Scholar] [CrossRef]
- Bartram, J.; Brocklehurst, C.; Bradley, D.; Muller, M.; Evans, B. Policy review of the means of implementation targets and indicators for the sustainable development goal for water and sanitation. Npj Clean Water 2018, 1, 3. [Google Scholar] [CrossRef]
- Guppy, L.; Mehta, P.; Qadir, M. Sustainable development goal 6: Two gaps in the race for indicators. Sustain. Sci. 2019, 14, 501–513. [Google Scholar] [CrossRef]
- Cossio, C.; Norrman, J.; McConville, J.; Mercado, A.; Rauch, S. Indicators for sustainability assessment of small-scale wastewater treatment plants in low and lower-middle income countries. Environ. Sustain. Indic. 2020, 6, 100028. [Google Scholar] [CrossRef]
- Reyers, B.; Folke, C.; Moore, M.; Biggs, R.; Galaz, V. Social-Ecological Systems Insights for Navigating the Dynamics of the Anthropocene. Annu. Rev. Environ. Resour. 2018, 43, 267–289. Available online: https://www.annualreviews.org/doi/pdf/10.1146/annurev-environ-110615-085349 (accessed on 2 May 2022). [CrossRef]


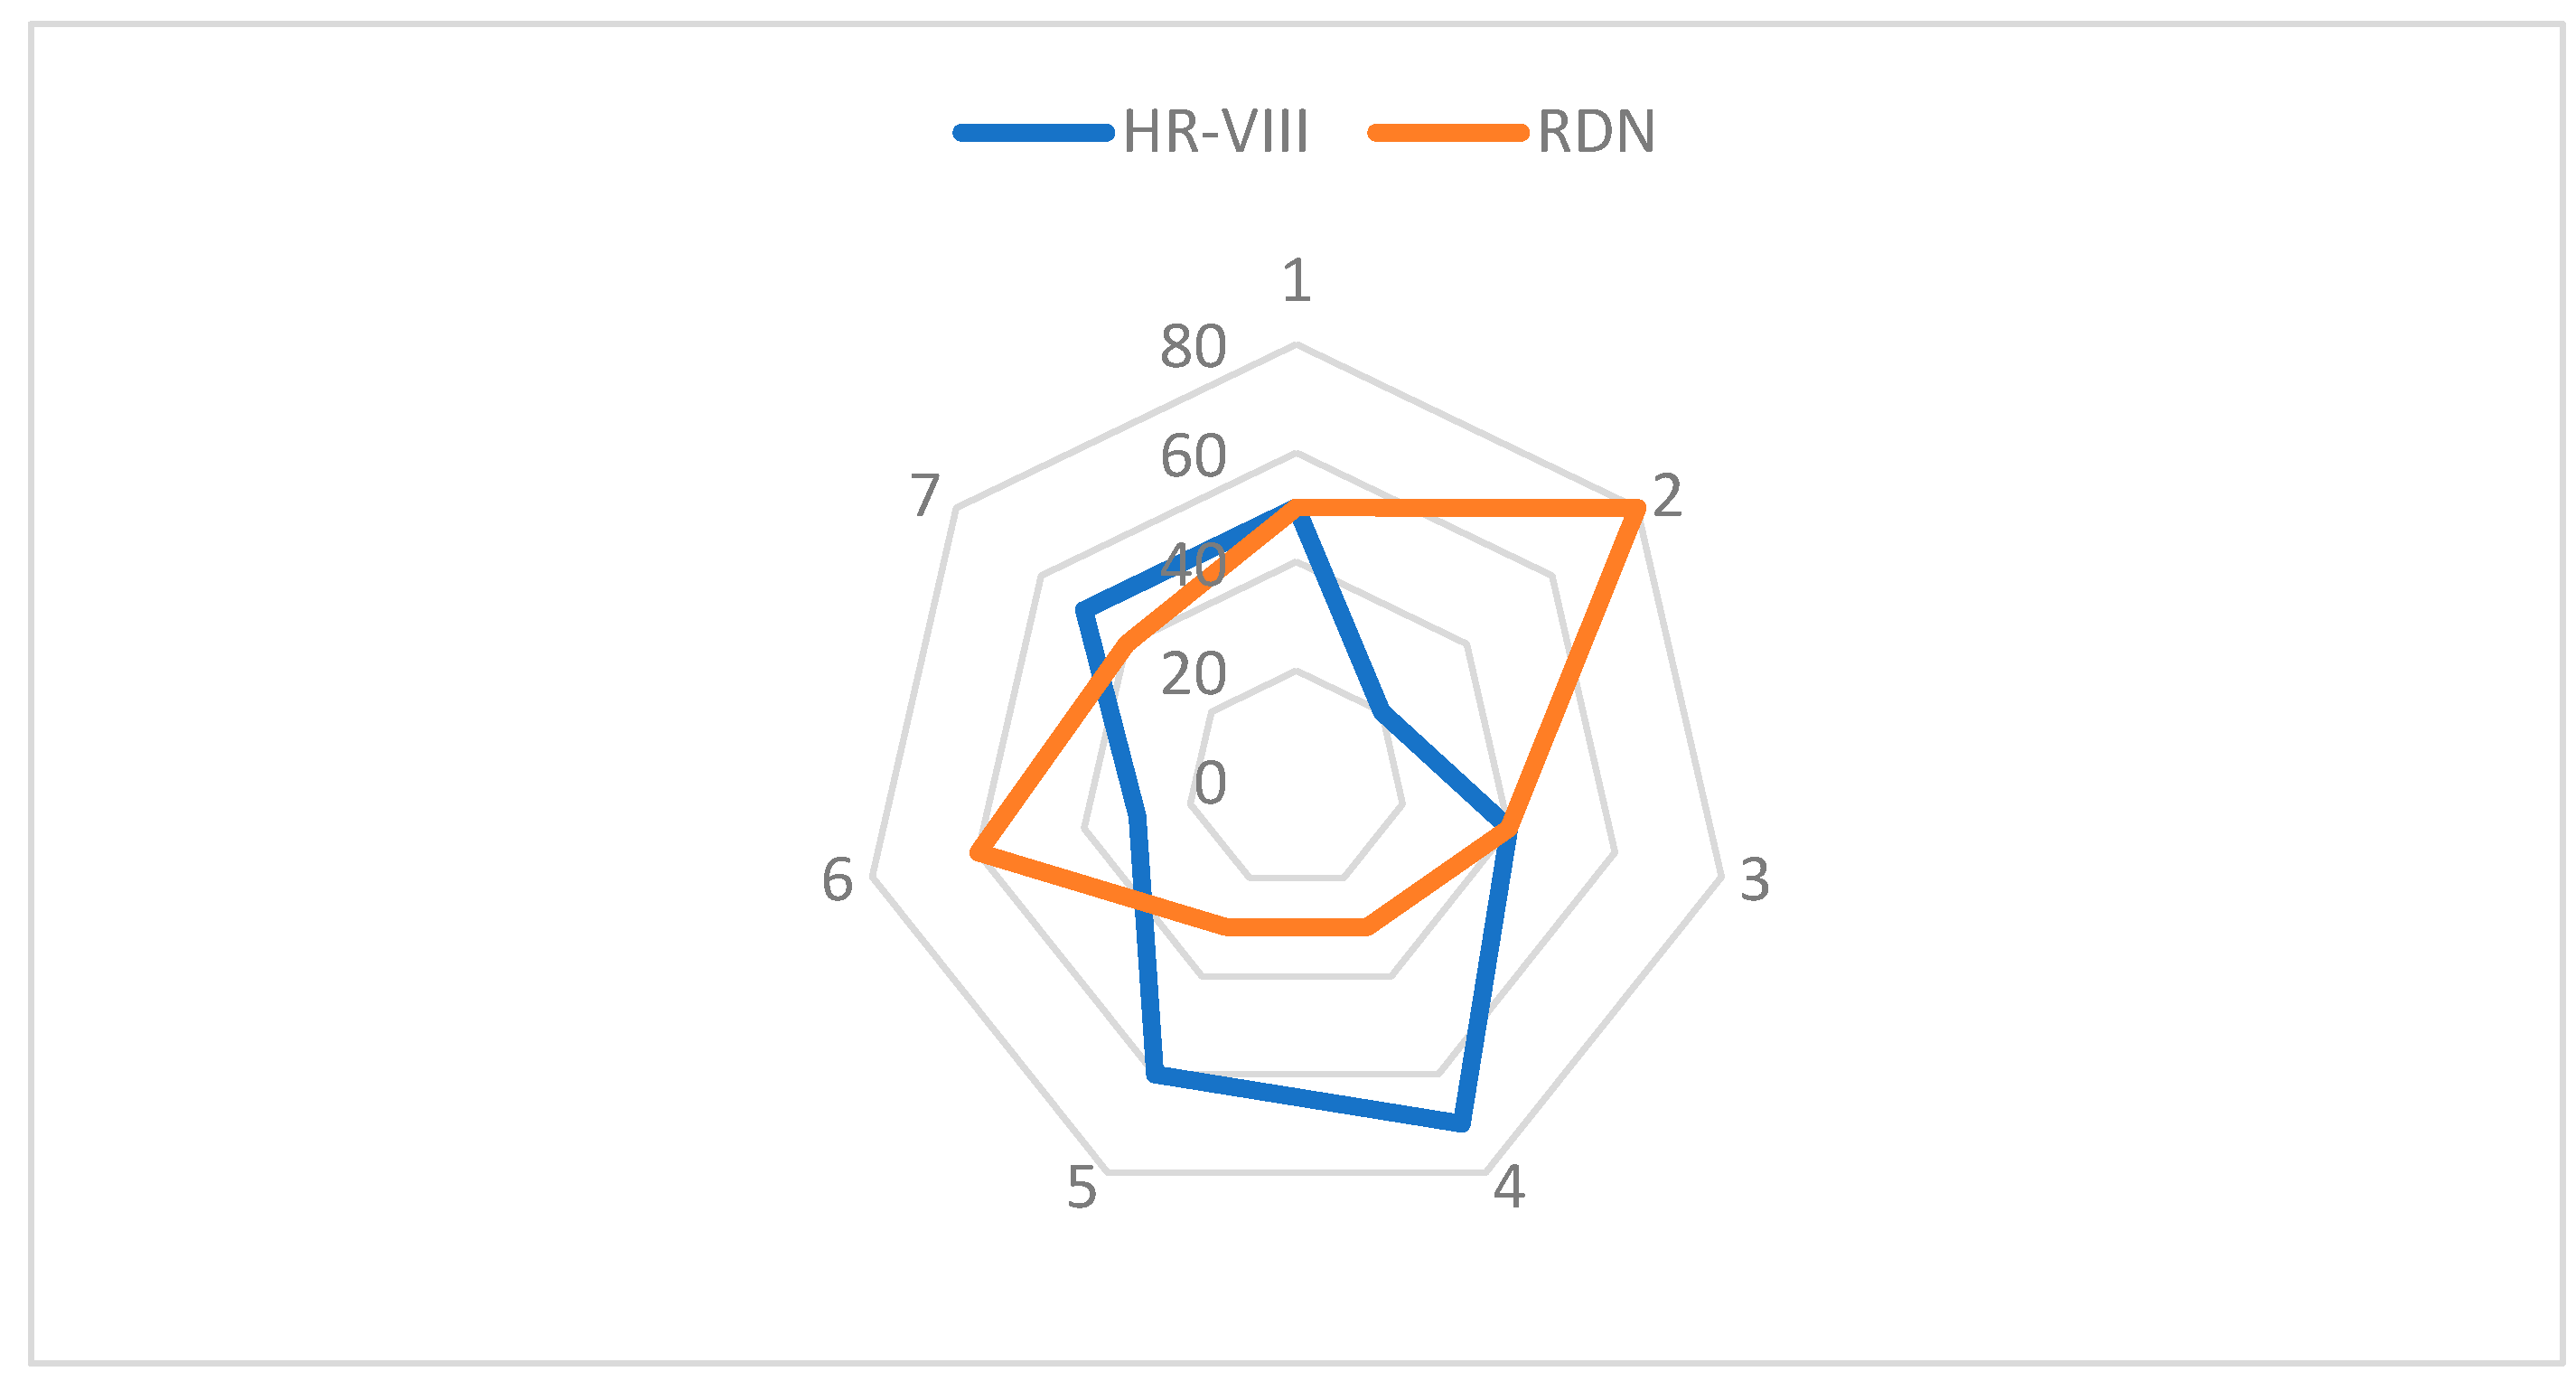
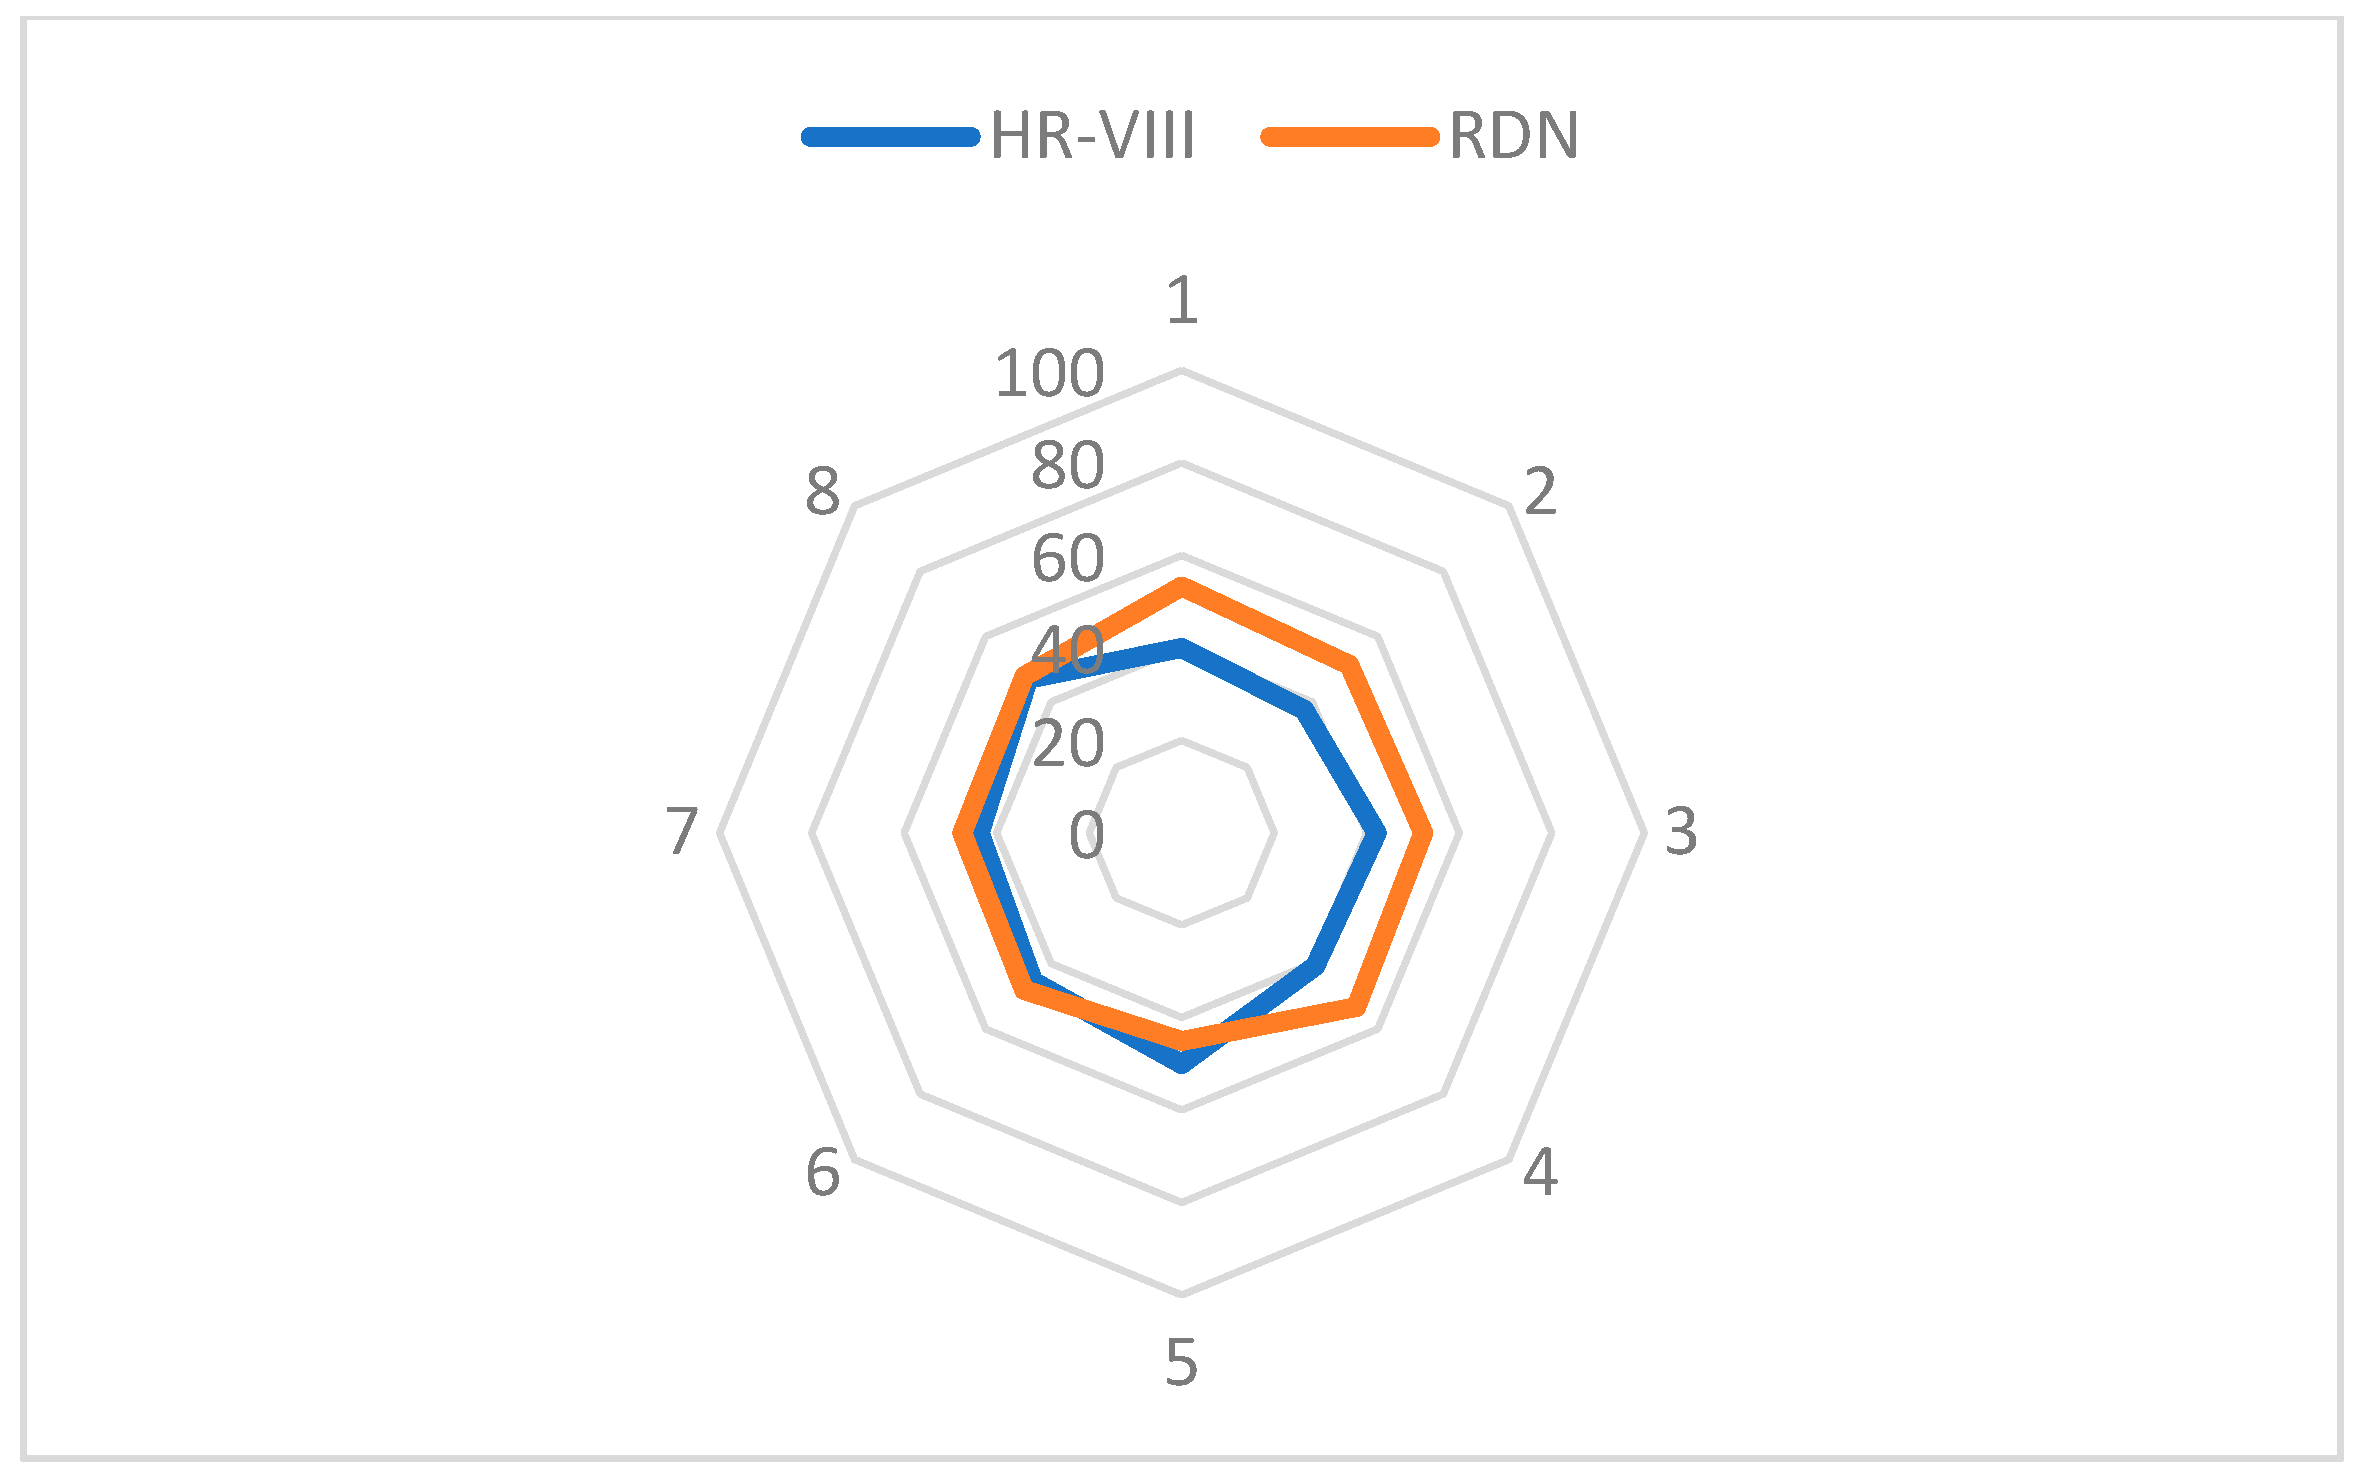
| Sustainability Principle | Thrivability Scale | |
|---|---|---|
| HR-VIII | RDN | |
| 1. Social-ecological system integrity | 50 | 50 |
| 2. Resource efficiency and maintenance | 20 | 80 |
| 3. Livelihood sufficiency and opportunity | 40 | 40 |
| 4. Civil engagement and democratic governance | 70 | 30 |
| 5. Intergenerational and intragenerational equity | 60 | 30 |
| 6. Interconnectivity from local to national/global scales | 30 | 60 |
| 7. Precaution and adaptability | 50 | 40 |
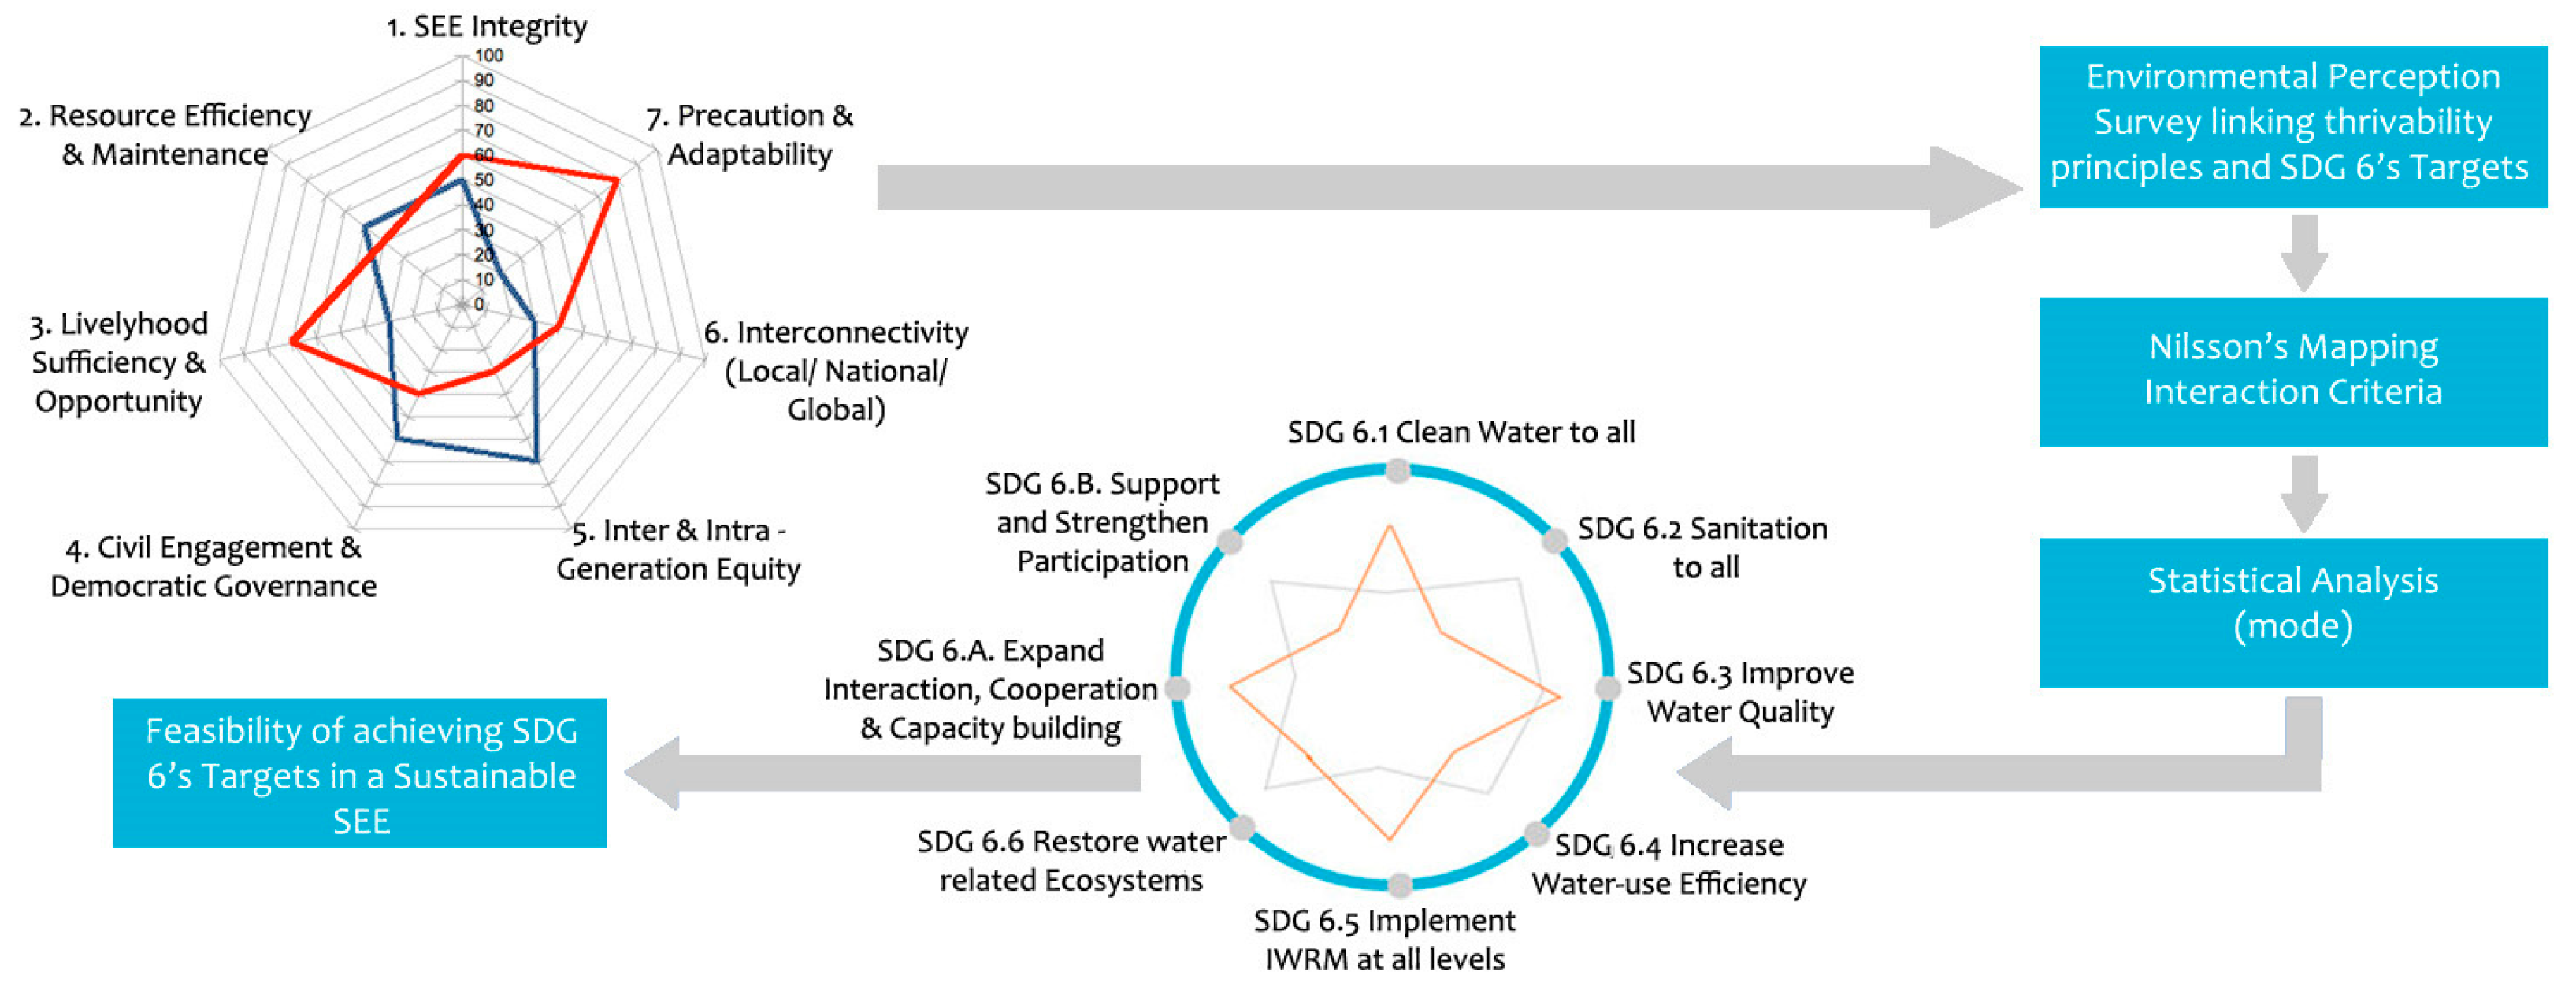
| SDG 6 Targets | Thrivability Appraisal Sustainability Principles Interactions (Modes of 51 Responses) | ||||||
|---|---|---|---|---|---|---|---|
| 1 | 2 | 3 | 4 | 5 | 6 | 7 | |
| 6.1 | 2 | 3 | 2 | 1 | 1 | 2 | 1 |
| 6.2 | 0 | 2 | 3 | 0 | 1 | 1 | 1 |
| 6.3 | 3 | 3 | 1 | 1 | 1 | 2 | 3 |
| 6.4 | 2 | 3 | 1 | 1 | 1 | 2 | 2 |
| 6.5 | 1 | 1 | 0 | 3 | 1 | 2 | 2 |
| 6.6 | 3 | 1 | 1 | 1 | 1 | 2 | 2 |
| 6.6a | 0 | 1 | 1 | 1 | 1 | 2 | 2 |
| 6.6b | 0 | 2 | 0 | 3 | 1 | 2 | 2 |
Disclaimer/Publisher’s Note: The statements, opinions and data contained in all publications are solely those of the individual author(s) and contributor(s) and not of MDPI and/or the editor(s). MDPI and/or the editor(s) disclaim responsibility for any injury to people or property resulting from any ideas, methods, instructions or products referred to in the content. |
© 2023 by the authors. Licensee MDPI, Basel, Switzerland. This article is an open access article distributed under the terms and conditions of the Creative Commons Attribution (CC BY) license (https://creativecommons.org/licenses/by/4.0/).
Share and Cite
Ferreira, M.I.P.; Sakaki, G.; Shaw, P.; Riscado, T.N.d.S.; Umbelino, L.F. Sustainable Water Management and the 2030 Agenda: Comparing Rain Forest Watersheds in Canada and Brazil by Applying an Innovative Sustainability Indicator System. Sustainability 2023, 15, 14898. https://doi.org/10.3390/su152014898
Ferreira MIP, Sakaki G, Shaw P, Riscado TNdS, Umbelino LF. Sustainable Water Management and the 2030 Agenda: Comparing Rain Forest Watersheds in Canada and Brazil by Applying an Innovative Sustainability Indicator System. Sustainability. 2023; 15(20):14898. https://doi.org/10.3390/su152014898
Chicago/Turabian StyleFerreira, Maria Inês Paes, Graham Sakaki, Pamela Shaw, Thaís Nacif de Souza Riscado, and Luis Felipe Umbelino. 2023. "Sustainable Water Management and the 2030 Agenda: Comparing Rain Forest Watersheds in Canada and Brazil by Applying an Innovative Sustainability Indicator System" Sustainability 15, no. 20: 14898. https://doi.org/10.3390/su152014898