What does it mean to be the world’s most unequal society?
The label is used so often it runs the risk of monotony. But a new report sheds light on the full, multidimensional nightmare of South African inequality.
Inequality between nations is worse than inequality within nations. This means that the economic distance between an impoverished Burundian and a wealthy Belgian, for example, is far greater than the economic distance between impoverished and wealthy people within Burundi itself.
There is only one place where the severity of this global inequality is mirrored at a national level: South Africa.
Here, the economic fortunes of the poorest people are similar to those of the most impoverished people in Burundi, while the richest people in South Africa can be compared to Belgium’s richest.
But what does it mean to be the world’s most unequal society?
An Inequality Trends report, the first of its kind, launched on November 14 2019 by Statistics South Africa (Stats SA) and the South African Labour and Development Research Unit (Saldru) at the University of Cape Town, gives us part of the answer.
Monetary inequality
While social grants and remittances have made the most notable headway in bridging the chasm between the runaway riches of South Africa’s wealthy few and the threadbare struggles of its impoverished majority, there is little to celebrate.
Income inequality in South Africa has deepened. According to the latest figures from the World Inequality Database, the top 1% of South African earners take home almost 20% of all income in the country, while the top 10% take home 65%. The remaining 90% of South African earners get only 35% of total income.
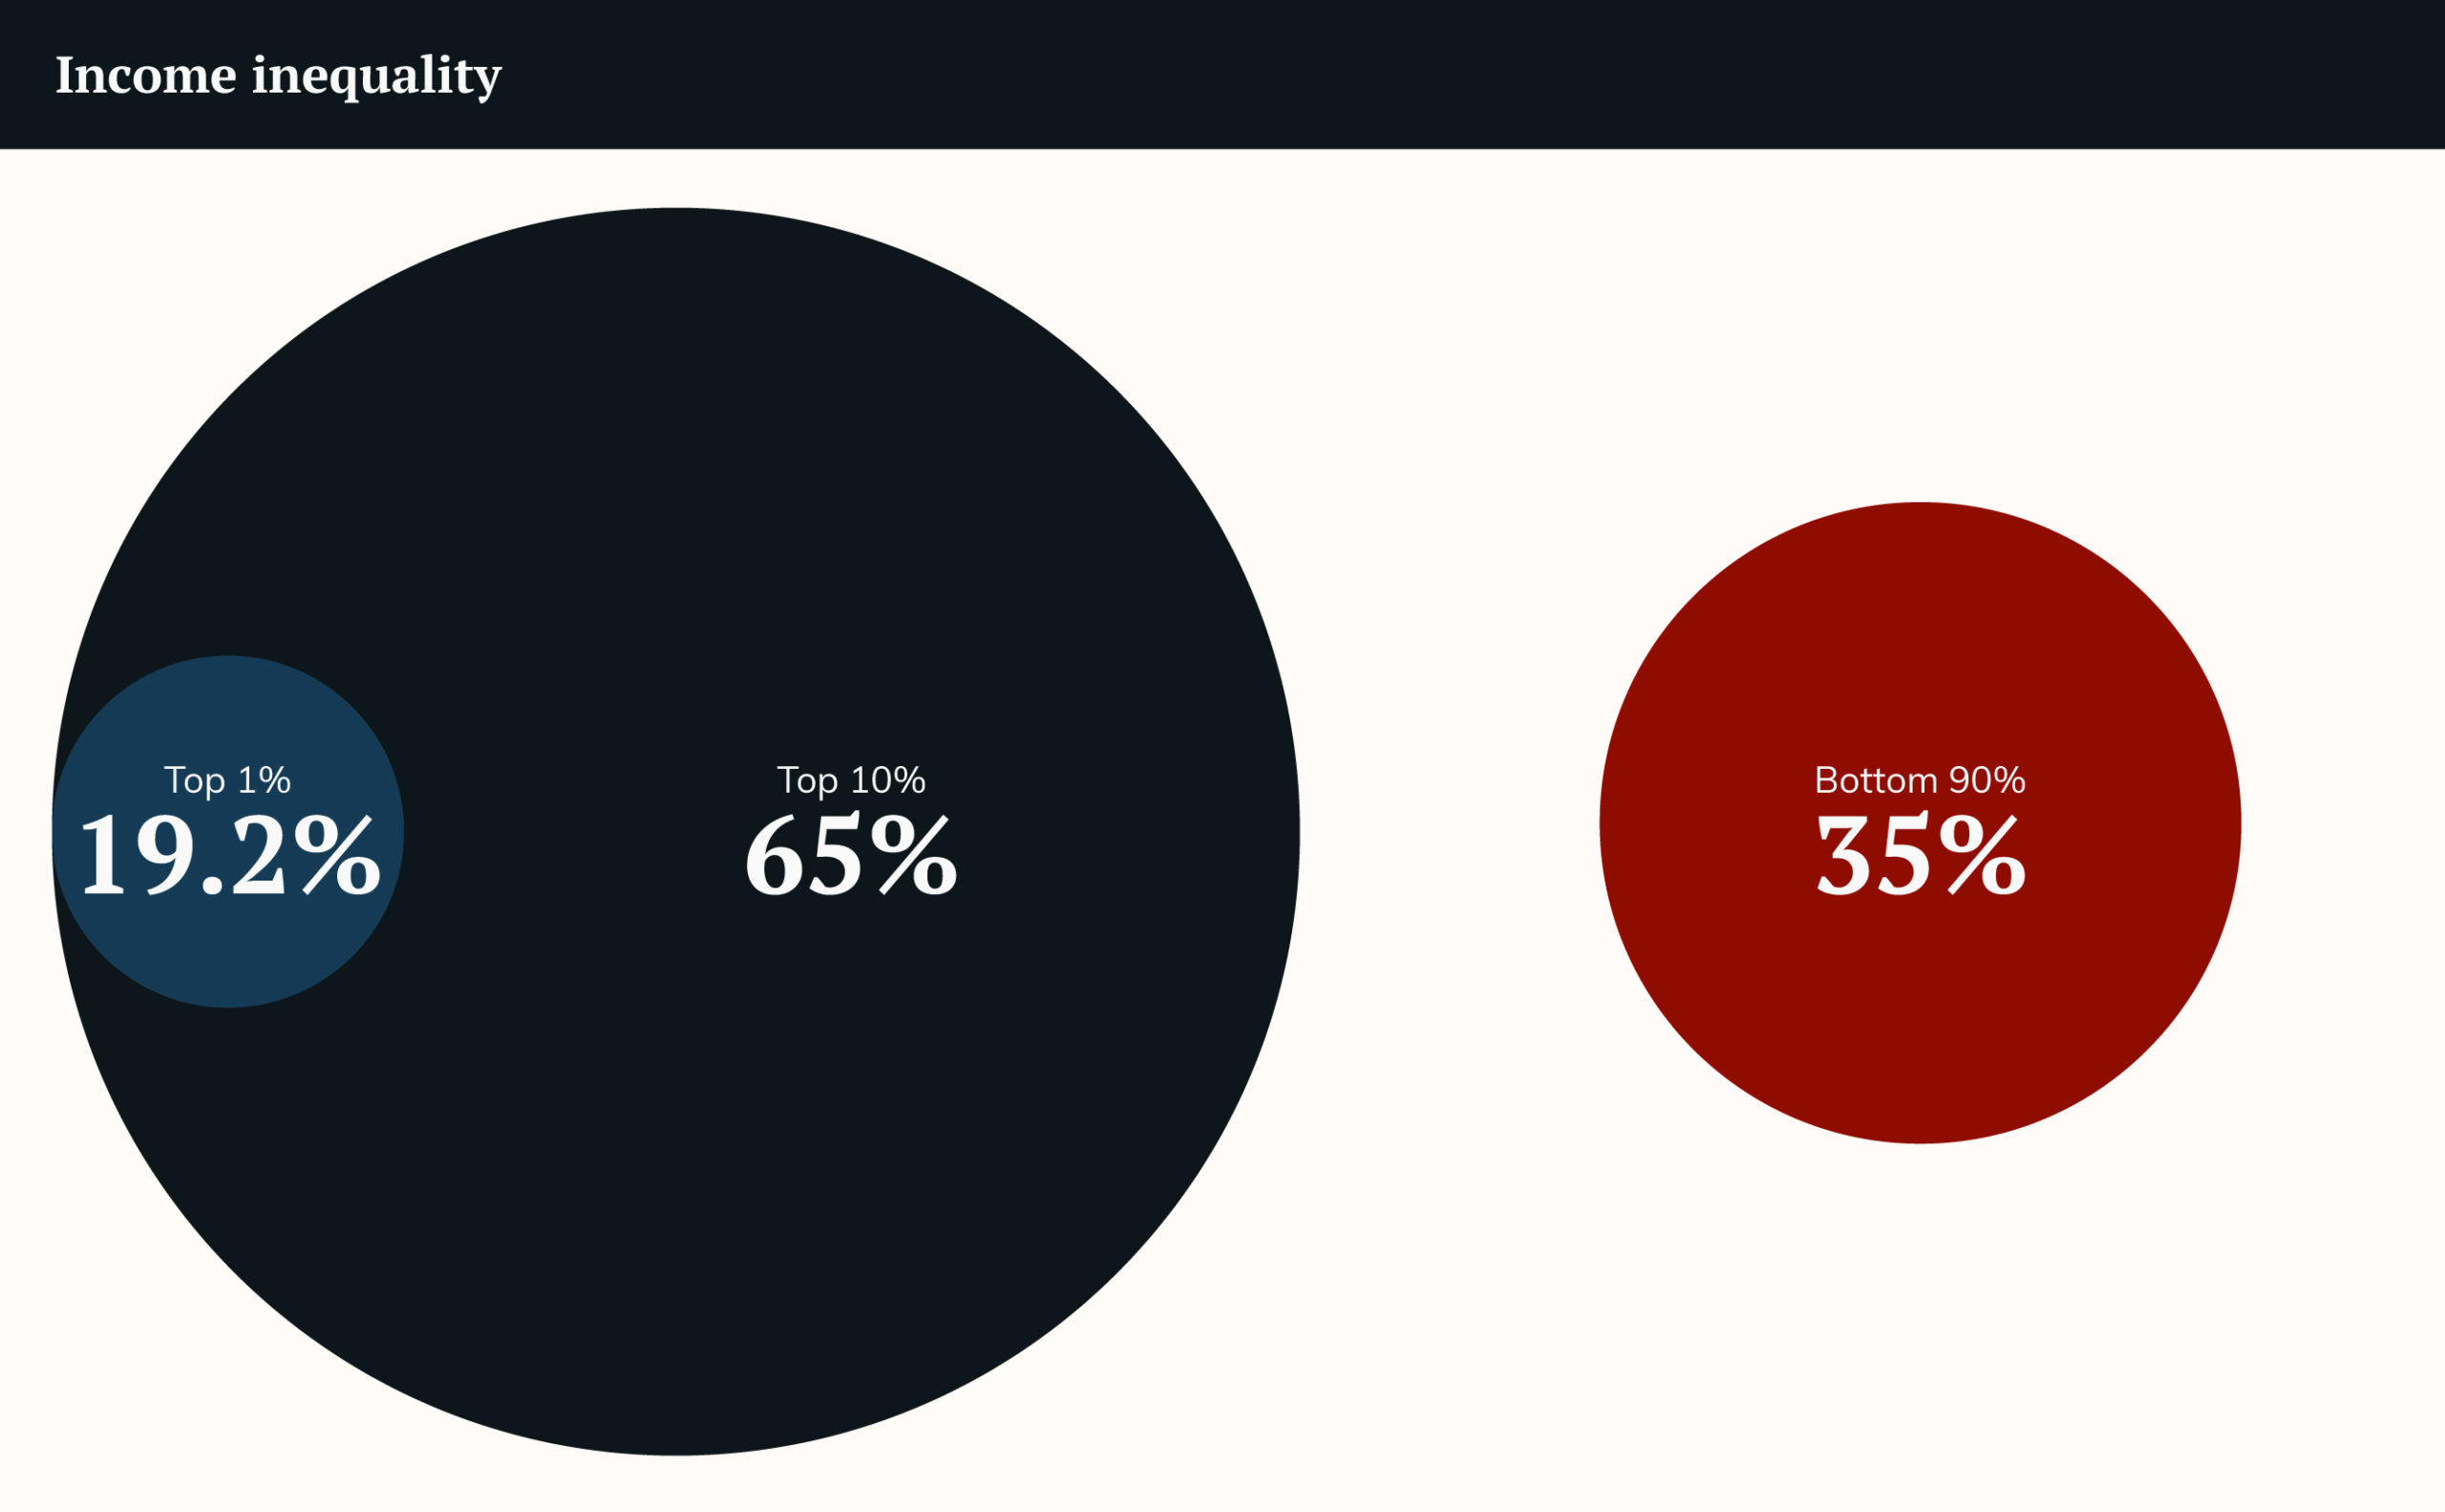
(Graphic: Infographic by Ryan Honeyball)
These unequal incomes, according to the Inequality Trends report, remain stubbornly racialised, gendered and spatialised.
White people are more likely to find work. And once they do, they also earn better. Between 2011 and 2015, a white person earned R24 646 per month on average, more than three times the R6 899 of their black counterparts. Female workers earned around 30% less than male workers during the same period, and workers in the countryside earned less than half of what urban workers did.
But why does the gap in South Africa’s earnings continue to widen? Here, the report delivers devastating evidence regarding the performance of incomes at the top and the bottom.
The real wages of the bottom 10% of earners have plummeted, shrinking by a quarter between 2011 and 2015. The country’s median incomes also shrank by 15%. By contrast, the earnings of the top 2% grew by 15% over that period, while those in the top 1% saw their earnings balloon by 48%.
Shrinking incomes for the majority in the face of huge growth in those of a handful at the top is not the only thing driving income inequality in South Africa. Economists Ihsaan Bassier and Ingrid Woolard have shown recently that financial capital is also a key contributor.
While the economy grew by only 4% between 2003 and 2016, the income received by the top 5% of the population from things like shares and capital gains grew by up to 20%. This kind of capital income represents nearly half of the income of the country’s richest 1%.
The wealth of a nation
There are deeper indicators of wellbeing than monetary measures, which Stats SA says “are central to understanding South Africa’s inequality and to understanding the processes that generate South Africa’s money-based inequality”.
To this end, the report measures changes in asset ownership. A rise in ownership of both public assets (where 61.7% of people owned a flush toilet in 2009, 67.6% owned one in 2015) and private assets (where 6.2% of people owned internet services in 2009, 11.8% did so in 2015) indicates a reduction in the inequality of asset ownership in South Africa.
In the absence of income tax data currently being compiled by the South African Revenue Service and the national treasury, Stats SA does not move beyond this asset inequality to measure wealth. As a result, the effects that financial assets like deposits, bonds, equities, life insurance and pension funds have on inequality are left unexplored in the report.
But recent research by Stellenbosch University economist Anna Orthofer delves into precisely these effects and finds that wealth inequality in South Africa is staggering. The wealthiest 1% owns 67% of all the country’s wealth. The top 10% owns 93%. The remaining 90% of South Africa owns a paltry 7% of the country’s wealth.
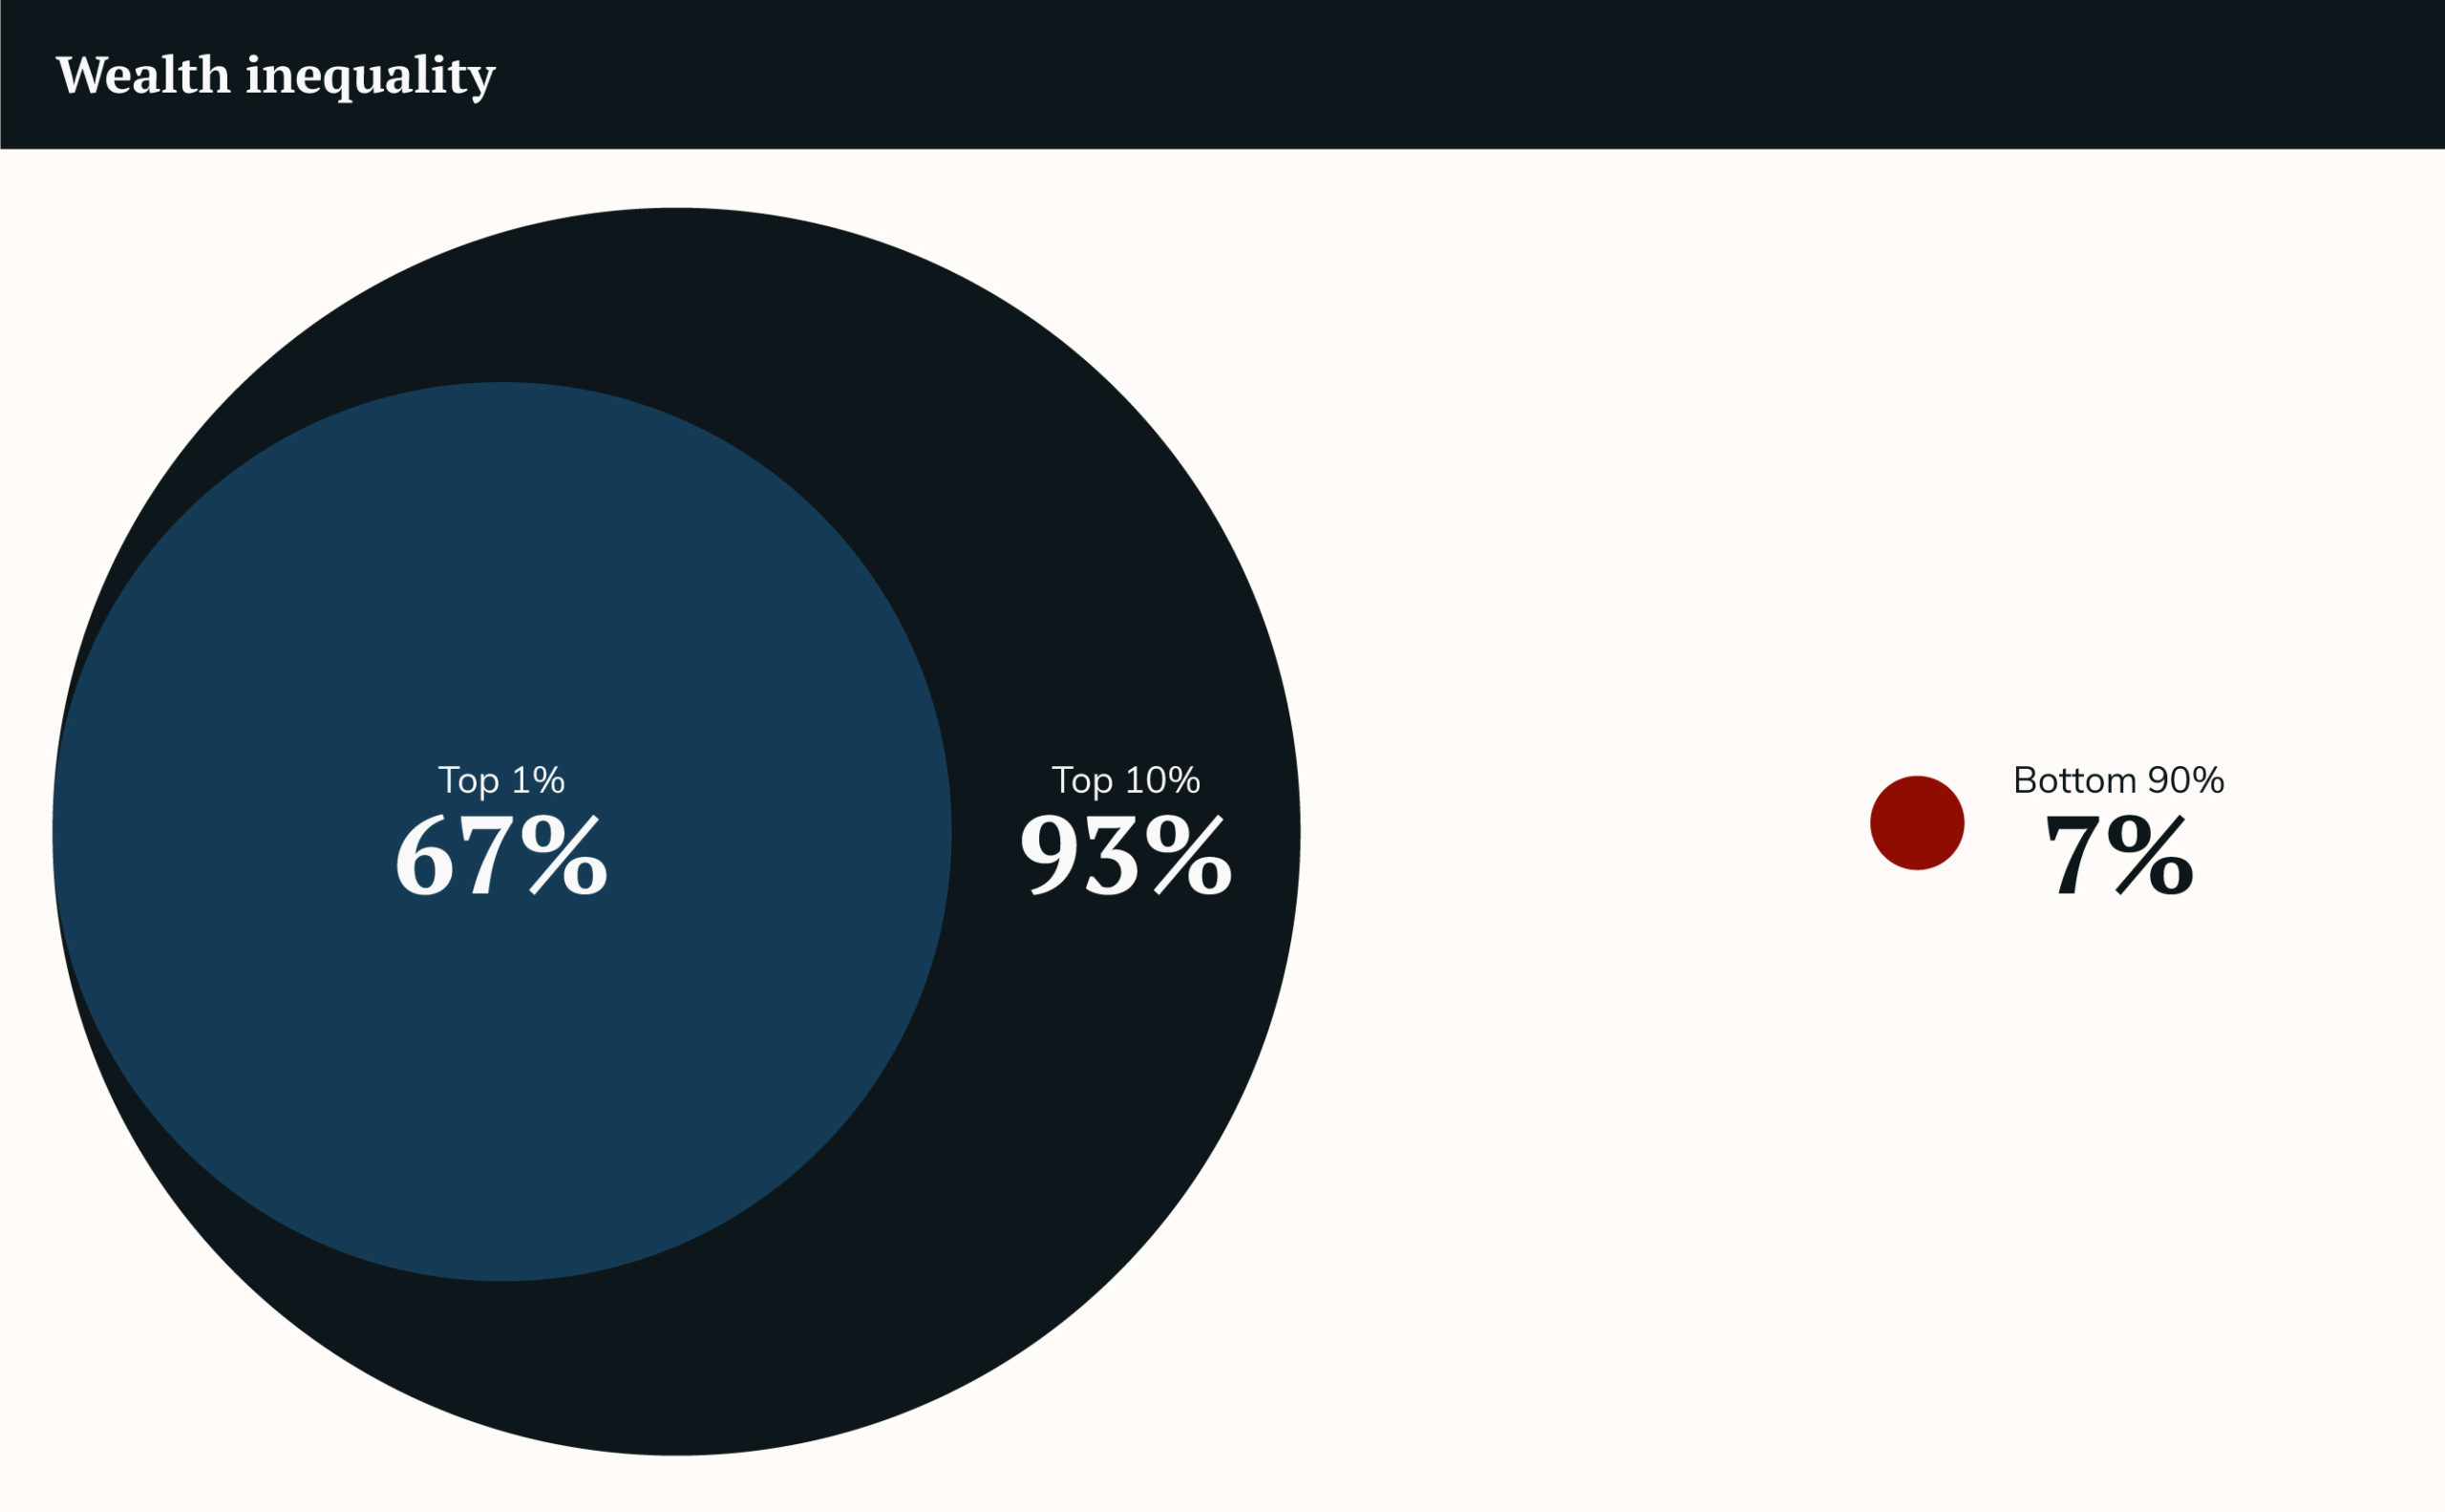
(Graphic: Infographic by Ryan Honeyball)
Inequality is spatial
The persistence of South Africa’s inequality a quarter century after formal democracy is, in large part, down to enduring colonial and apartheid geographies.
In the cities, skewed spatial legacies go a long way towards determining opportunities. (While Stats SA’s report does not delve into the details of city structure, 2016 research by the Socio-Economic Rights Institute of South Africa show that the peripheral homes of many black communities directly undermine their ability to find work.) And ethnic Bantustan borders imagined by apartheid law makers still map neatly along contours of access in the countryside.

(Graphic: Infographic by Ryan Honeyball)
While there have been demonstrable gains in the provision of basic services since the end of apartheid, the Inequality Trends report highlights that pockets of deprivation persist in South Africa’s former homelands. Areas where more than half of households are still unable to access piped water, for example, are still largely in the rural Eastern Cape and KwaZulu-Natal.
Inequality in access to other services also still hews to Bantustan boundaries. Only 41.8% of impoverished Limpopo homes, for example, mostly in former Venda, Lebowa and Gazankulu, had access to improved sanitation in 2015.
This article was first published by New Frame.