
The case for a fiscal anchor framework
No doubt about it: the federal government’s fiscal position changed dramatically during 2020. The decline in real GDP over the first half of 2020 was the largest decline on record and three times larger than that of the 2008-09 financial crisis, leading to a dramatic deterioration in government revenues. Simultaneously, the federal government launched a host of initiatives aimed at bolstering household and business balance sheets to help Canadians manage through the pandemic. As a result, the 2020 Fall Economic Statement indicated that the fiscal deficit is projected to reach $381.6 billion in 2020-2021, which represents 17.5 per cent of GDP.
As Canada struggles against the pandemic’s second wave, support from government is expected to continue in 2021, which will only lead to a further deterioration in the country’s long-term fiscal standing. Many observers have thus called on government to adopt a strict fiscal anchor – that is, adopting guidelines or limits on a fiscal metric or series of metrics to ensure the sustainability of the government’s fiscal position. In the 2020 Fall Economic Statement, the government states it will outline a long-term fiscal anchor when the economy is more stable. Our recommendation is that fiscal anchor be defined sooner – in Budget 2021.
Why Canada needs a stronger fiscal anchor
At first glance, the situation may not seem as dire as some are claiming.
The current government made several commitments related to fiscal discipline when it was first elected in 2015, including a declining net debt-to-GDP ratio over time – a fiscal anchor of sorts. Indeed, that has been the case over the last four years as the debt burden has fallen very modestly from 31.9 per cent of GDP in 2016 to an estimated 31.3 per cent as of the beginning of 2020. This was the lowest among the G7, according to the IMF, and gave the impression of a strong starting point to stimulate the economy as we entered the pandemic.
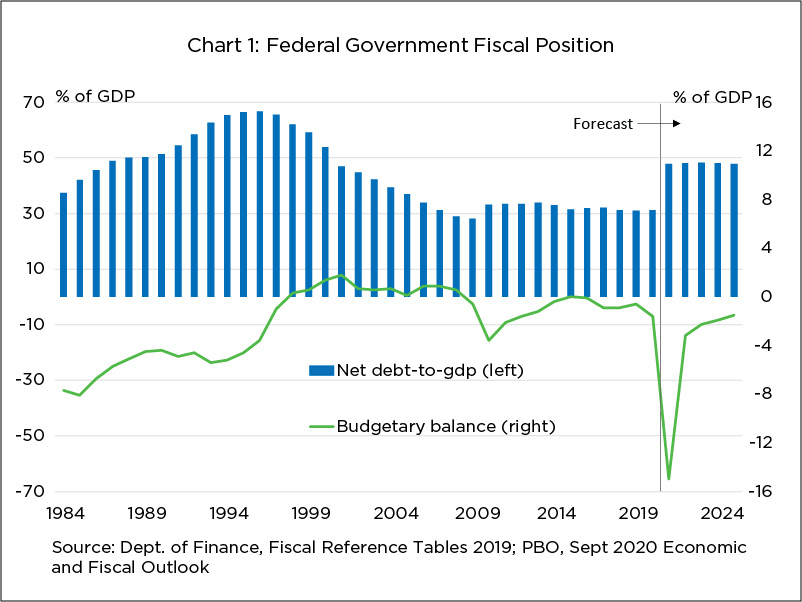
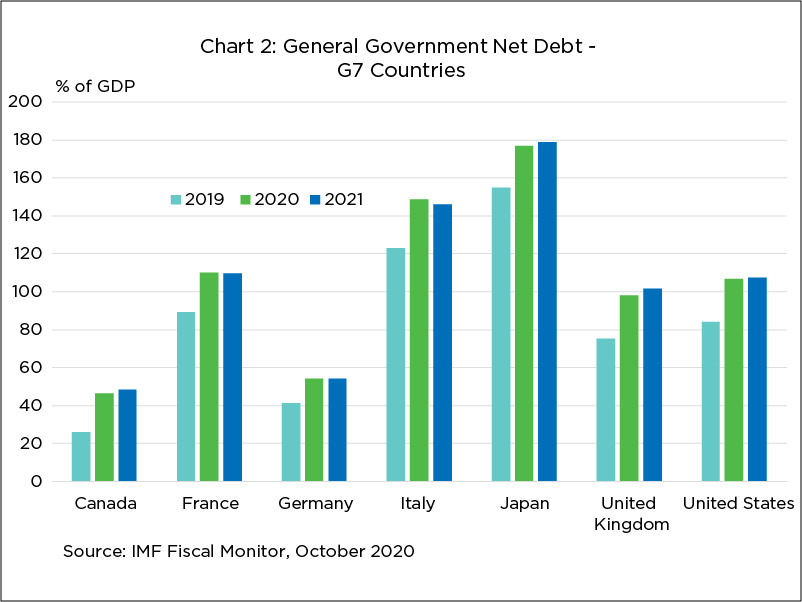
Despite the record deficit to be posted this year, the impact on the debt ratio may not be so significant as to raise serious red flags among Canadians – according to its September 2020 report, the PBO estimates that the ratio will cap out at 48.3 per cent by 2023, before resuming its decline (Chart 1). And the International Monetary Fund still expects Canada to have the lowest debt burden in the G7 (Chart 2). Furthermore, many observers have noted that, so long as the Canadian economy’s (and thus government revenues) rate of growth is higher than the interest rate paid, then even a relatively high debt load could be deemed sustainable. Notionally, this would be the case in late 2020. Even if one considers the lower bound of long-term economic projections for Canadian nominal GDP growth of between 2.5 and three per cent, 10-year government bonds are averaging just above 0.50 per cent in November 2020, with little evidence that they’ll match long-term nominal GDP growth, even over the medium term given the Bank of Canada’s dovish stance.
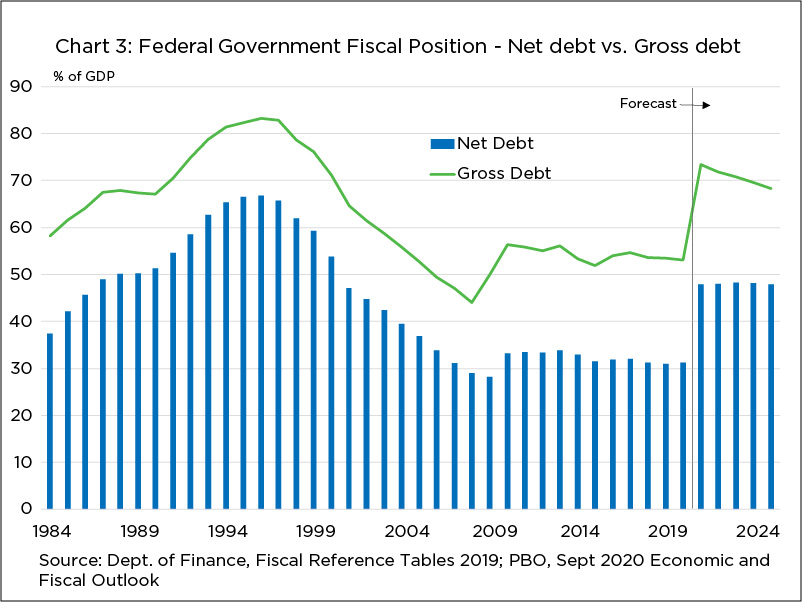
That being said, the problem with these statistics is that they mask a series of underlying issues. First, when government refers to net debt, they are in fact referring to a concept known as the accumulated deficit. This measure considers the overall financial position of government by subtracting both financial and non-financial assets from the gross amount of liabilities outstanding. The actual gross debt of the federal government – on which interest is payable – is far higher, at 53.1 per cent of GDP as opposed to 31.3 per cent as of the beginning of this year (Chart 3). The most recent PBO forecast anticipates that figure to rise to as high as 73.4 per cent next year.
If we consider any additional spending that will occur to combat the second wave of the pandemic, the gross debt-to-GDP ratio may hover dangerously close to, if not exceed the level it reached in the mid-1990s. This was a tumultuous period in our fiscal history, preceded by a long track record of large, structural deficits – themselves the result of an unfettered expansion of government spending going back to the 1970s, including the indexation of social security benefits to inflation, such as Old Age Security, the Guaranteed Income Supplement, and the Canada Pension Plan, without simultaneous consideration of their impact on the deficit. While well-intentioned, these deficits ultimately led to a gradual loss of investor confidence through the 1990s, resulting in several downgrades to Canada’s sovereign debt rating and a modest back-up of interest rates and debt carrying costs. Canada’s fiscal crisis was only resolved after great effort by the federal government of the day to bring down the deficit, including painful and severe reductions in government program spending.
Moreover, one cannot consider the sustainability of the federal government in isolation from the provinces. Canada has the highest rate of subnational government spending in the OECD, due to several large expenditure portfolios, namely education and health care, being provincial jurisdiction. In 2014, the combined provincial, territorial and municipal governments collectively accounted for 77.6 per cent of total government spending, more than double the OECD average of 31.9 per cent. A high debt load at the combined provincial level does impact the sustainability of the federal debt due to the limited capacity of the taxpayer to fund both. A recent analysis conducted prior to the pandemic, for example, estimated that the increase in government gross liabilities between 2001 and 2017 would triple from $343 billion to $1.1 trillion if provincial and federal gross liabilities were combined.
This is why this discussion is important – the level of debt held by the federal government is, in fact, not inconsequential, and one cannot always depend on bond markets to remain open to financing persistent deficits. Thus, a fiscal anchor should not be seen exclusively as a limit on government’s ability to spend, notably during an economic crisis, but rather as a tool to give confidence to financial markets that the long-term sustainability of government is sound.
Options for an anchor
To that end, there have been many recent works—issued by the C.D. Howe Institute (including a second one by C.D. Howe), the Business Council of Canada and the Public Policy Forum, among others—discussing the various options for a possible fiscal anchor:
- some version of the debt-to-GDP ratio
- the deficit-to-GDP ratio
- expenditure-to-GDP ratio, or expenditure growth
- the debt-service ratio
Any individual metric or combination of these metrics would serve the purpose of both limiting and holding government to account for potentially profligate spending. However, they all simultaneously suffer from the same flaws. Notably, that too strict a limit on any fiscal anchor prevents government from acting during an economic crisis. Conversely, should the limit be too soft, a fiscal anchor has little hope in holding government to account. In addition, outside of capping expenditure growth, each of these anchors have an element that is beyond the government’s control. Consider the debt service ratio or the debt and deficit-to-GDP ratios – these can all move and potentially breach any strict limit independent of any particular actions of government should either interest rates move sharply upwards, or if the economy falls suddenly. The pandemic is a case in point.
A mechanical adoption of one or more of these as a definitive limit to government spending can thus lead to procyclical government policy that, historically, tends to backfire in the wrong situation.
Suggestions for a fiscal framework
A fiscal anchor could benefit more from a framework that addresses the shortcomings of any individual metric. Elements of such a framework should include:
- implementing standards or limits on government spending and indebtedness, considering a broad range of metrics
- remaining flexible enough to allow for countercyclical policy during economic events
- allowing for an independent or multi-party body, such as the PBO or a parliamentary committee, to both monitor and hold government to account if deviations from those limits occur
- being simple enough for the Canadian public to understand
This framework leverages the evolution of the European Union’s fiscal anchor, the original iteration of which was formalized in 1992, but has since gone through several legislative changes to account for the very issues described above. Originally, EU members were bound to reference values for the deficit and gross debt-to-GDP ratios of three per cent and 60 per cent, respectively. Any member whose levels were over these values triggered an excessive deficit procedure (EDP), which allowed an independent body to both suggest policy recommendations to return an offending member to good standing and impose punitive measures should both the deficit and debt not show improvement.
A recent analysis discussed the shortcomings of the original version of the fiscal anchor, however, detailing how several pieces of legislation introduced between 1999 and 2013 both strengthened oversight on member countries’ fiscal health, but also provided more flexibility. These changes included more consideration of the near-term economic circumstances and allowing members to implement countercyclical policy without facing the consequences of the EDP. In addition, more metrics were included for consideration in assessing a member government’s fiscal trajectory, such as net expenditure growth.
Conclusion
The COVID-19 pandemic has placed the federal government’s fiscal health under a spotlight. Emergency measures have been critical in stemming the economic impact of business shutdowns, which may continue to be needed given the evolution of the virus’ second wave. However, Canada’s fiscal history is also rife with examples of profligate spending that ultimately put the sustainability of government finances at risk several or many years in the future. This is why now is the time for government to adopt a fiscal anchor and a long-term plan to address the fiscal imbalance – to give the public and financial markets confidence that both the deficit and debt will be addressed. There are many ways to achieve this goal and we support a balanced fiscal anchor that takes into consideration both the benefits and drawbacks of various measures and frameworks.