
Evaluation of a High-Sensitivity Organ-Targeted PET Camera

 ,
,
Abstract
:1. Introduction
2. Materials and Methods
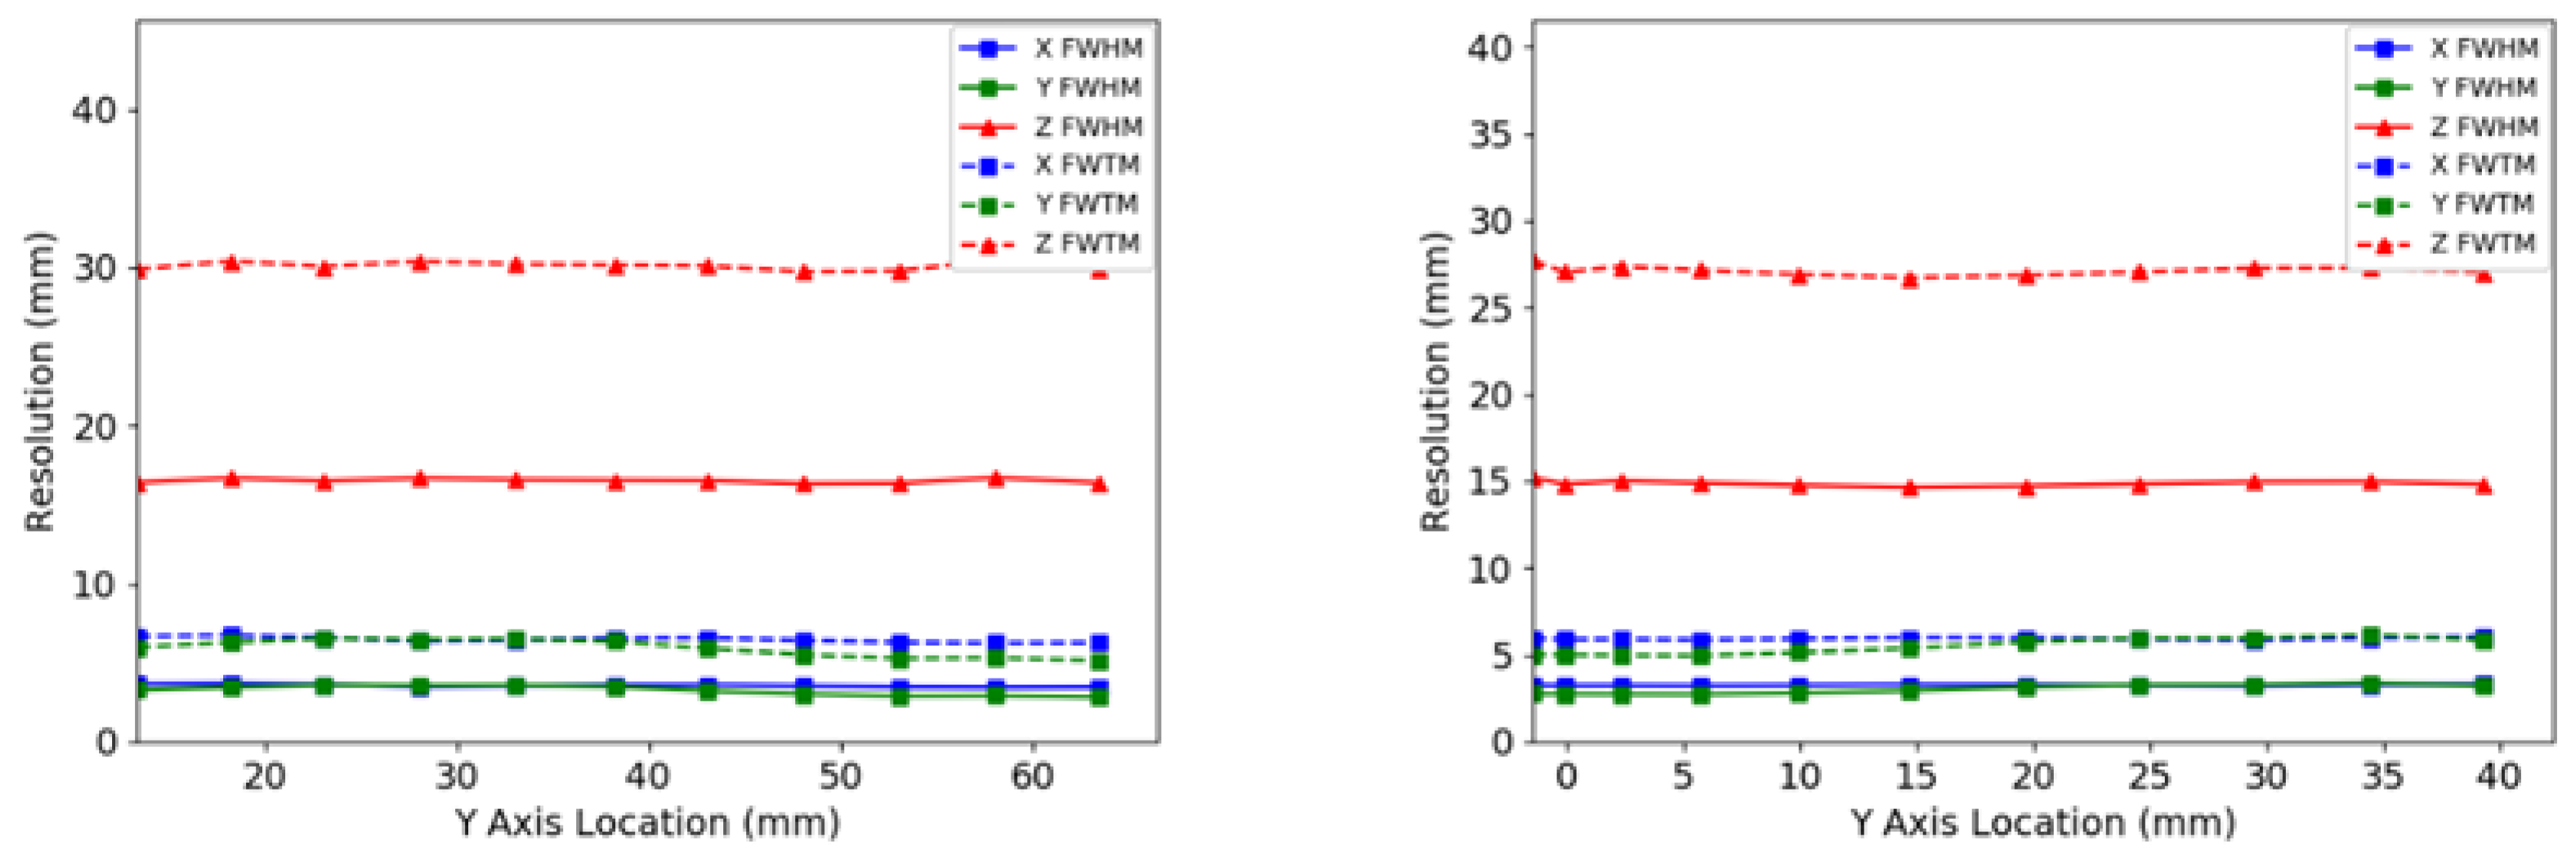
2.1. Spatial Resolution
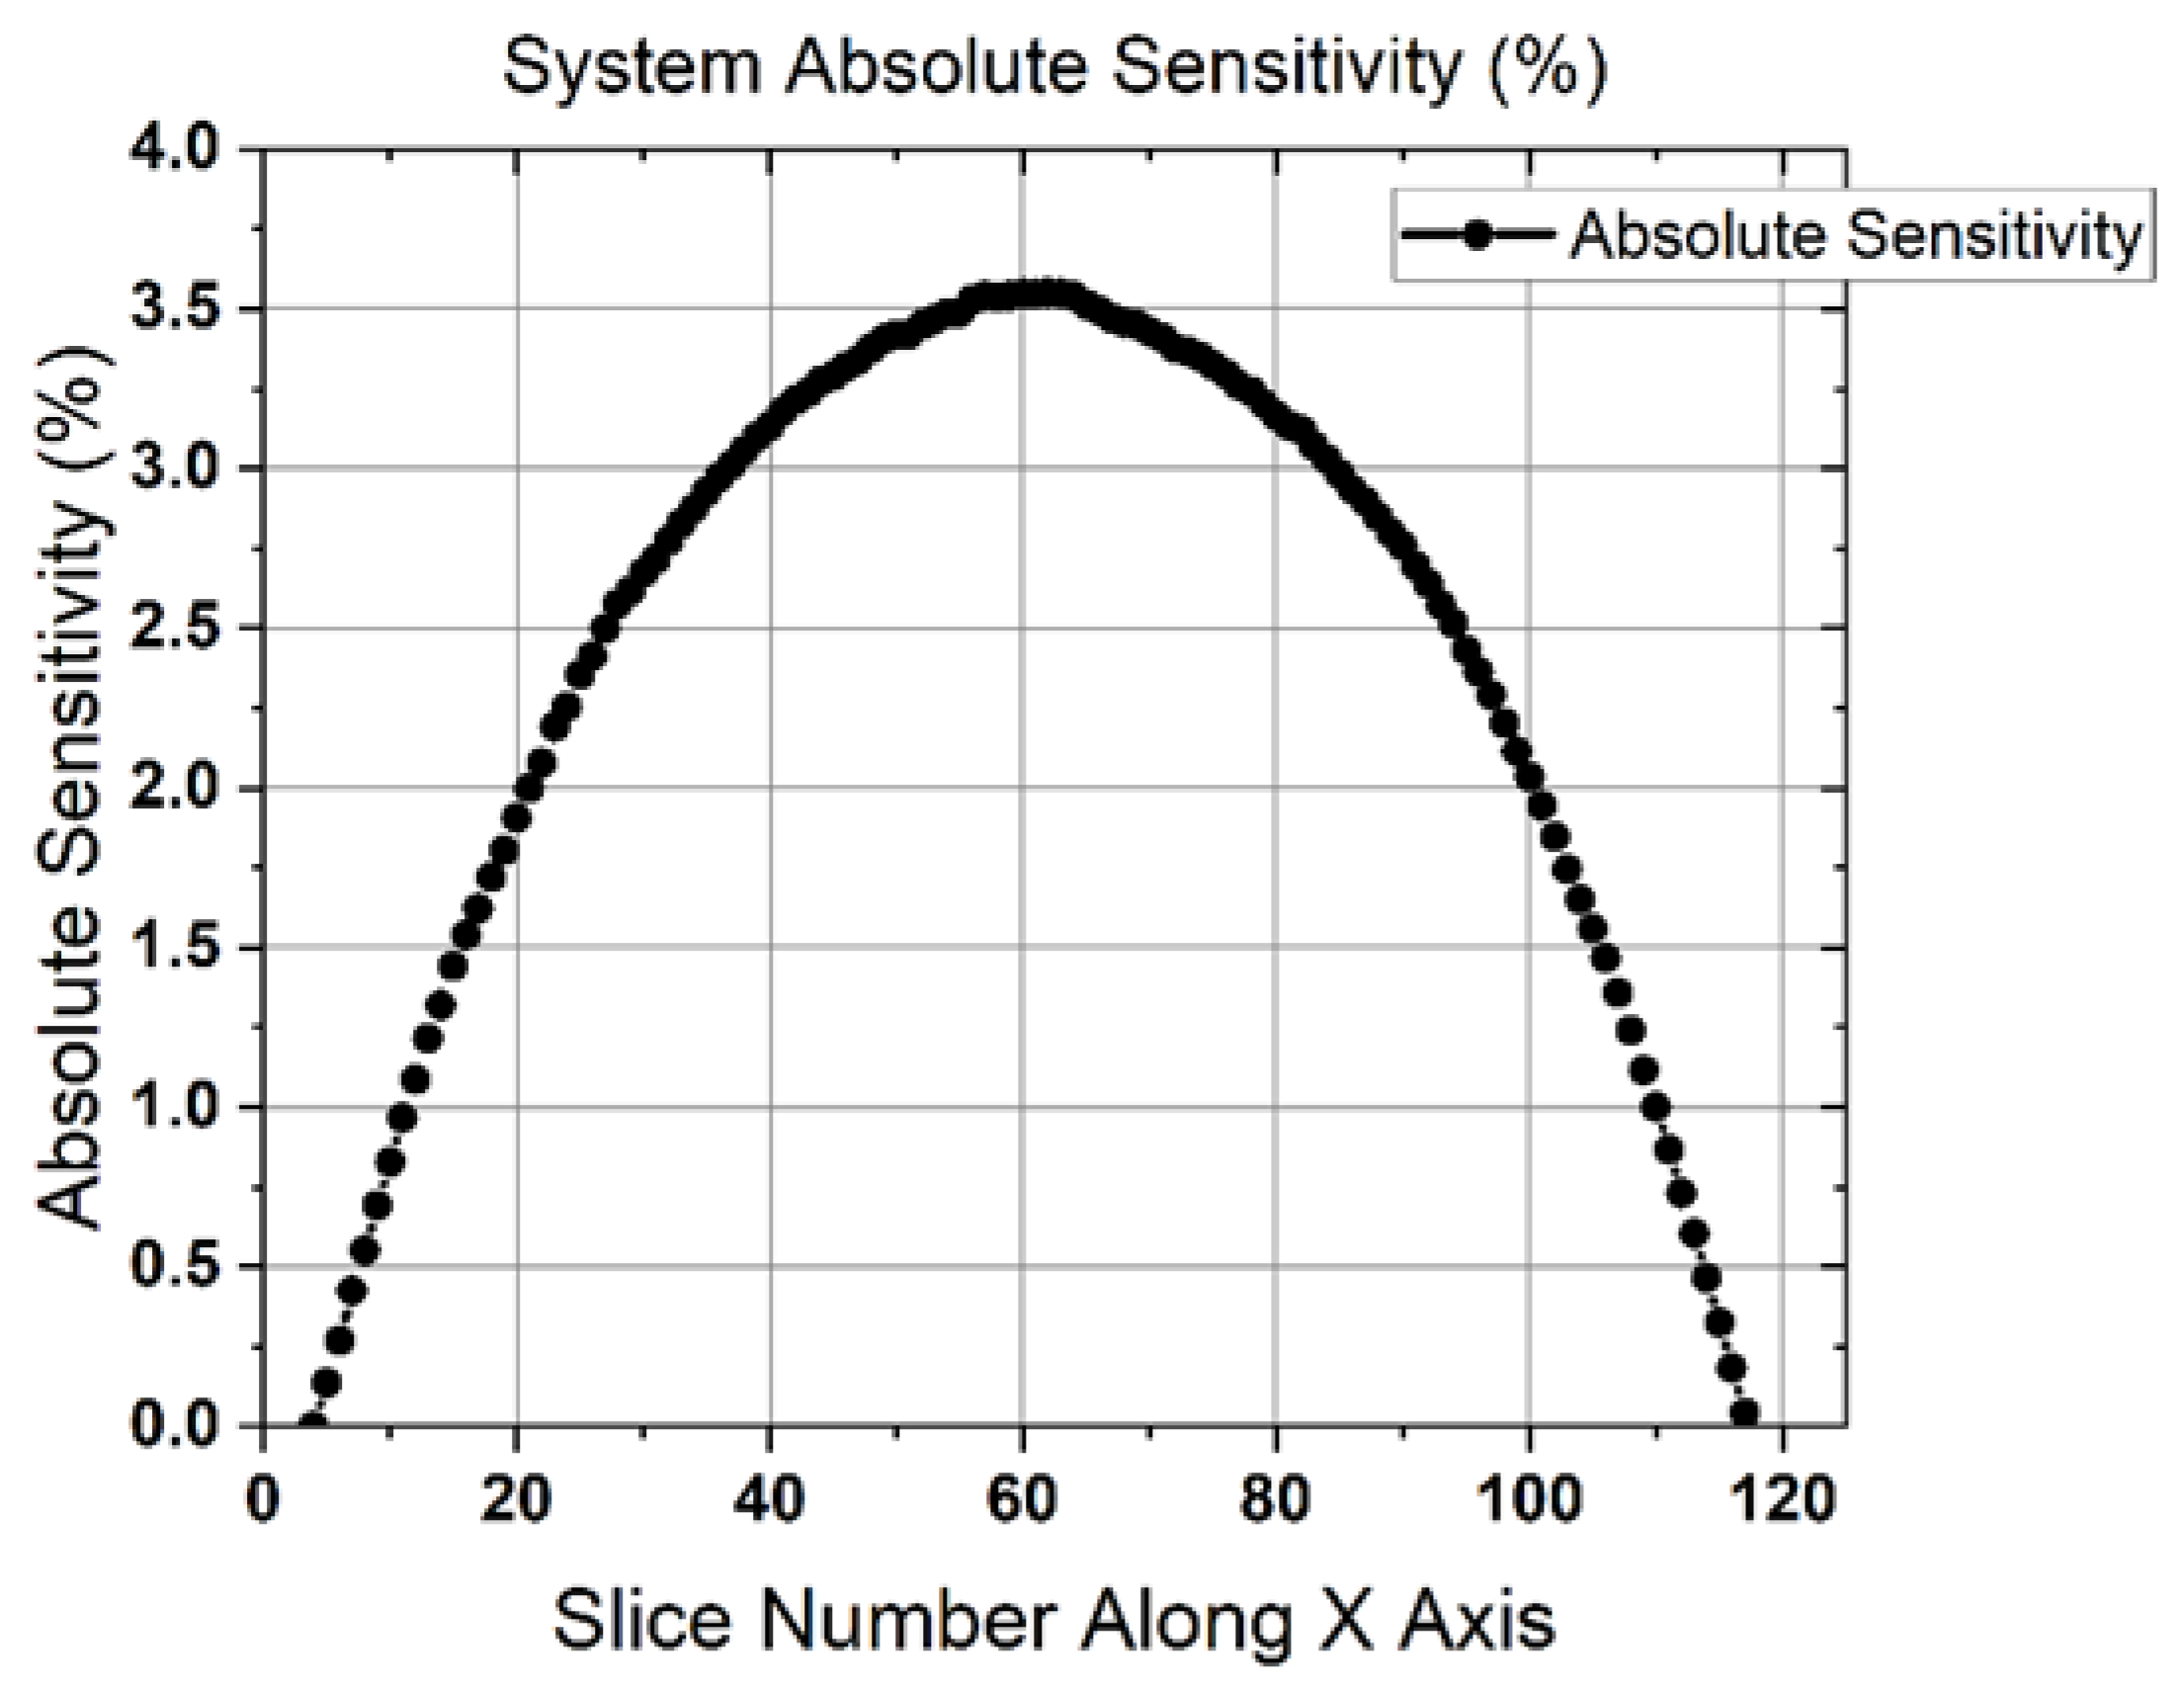
2.2. Sensitivity
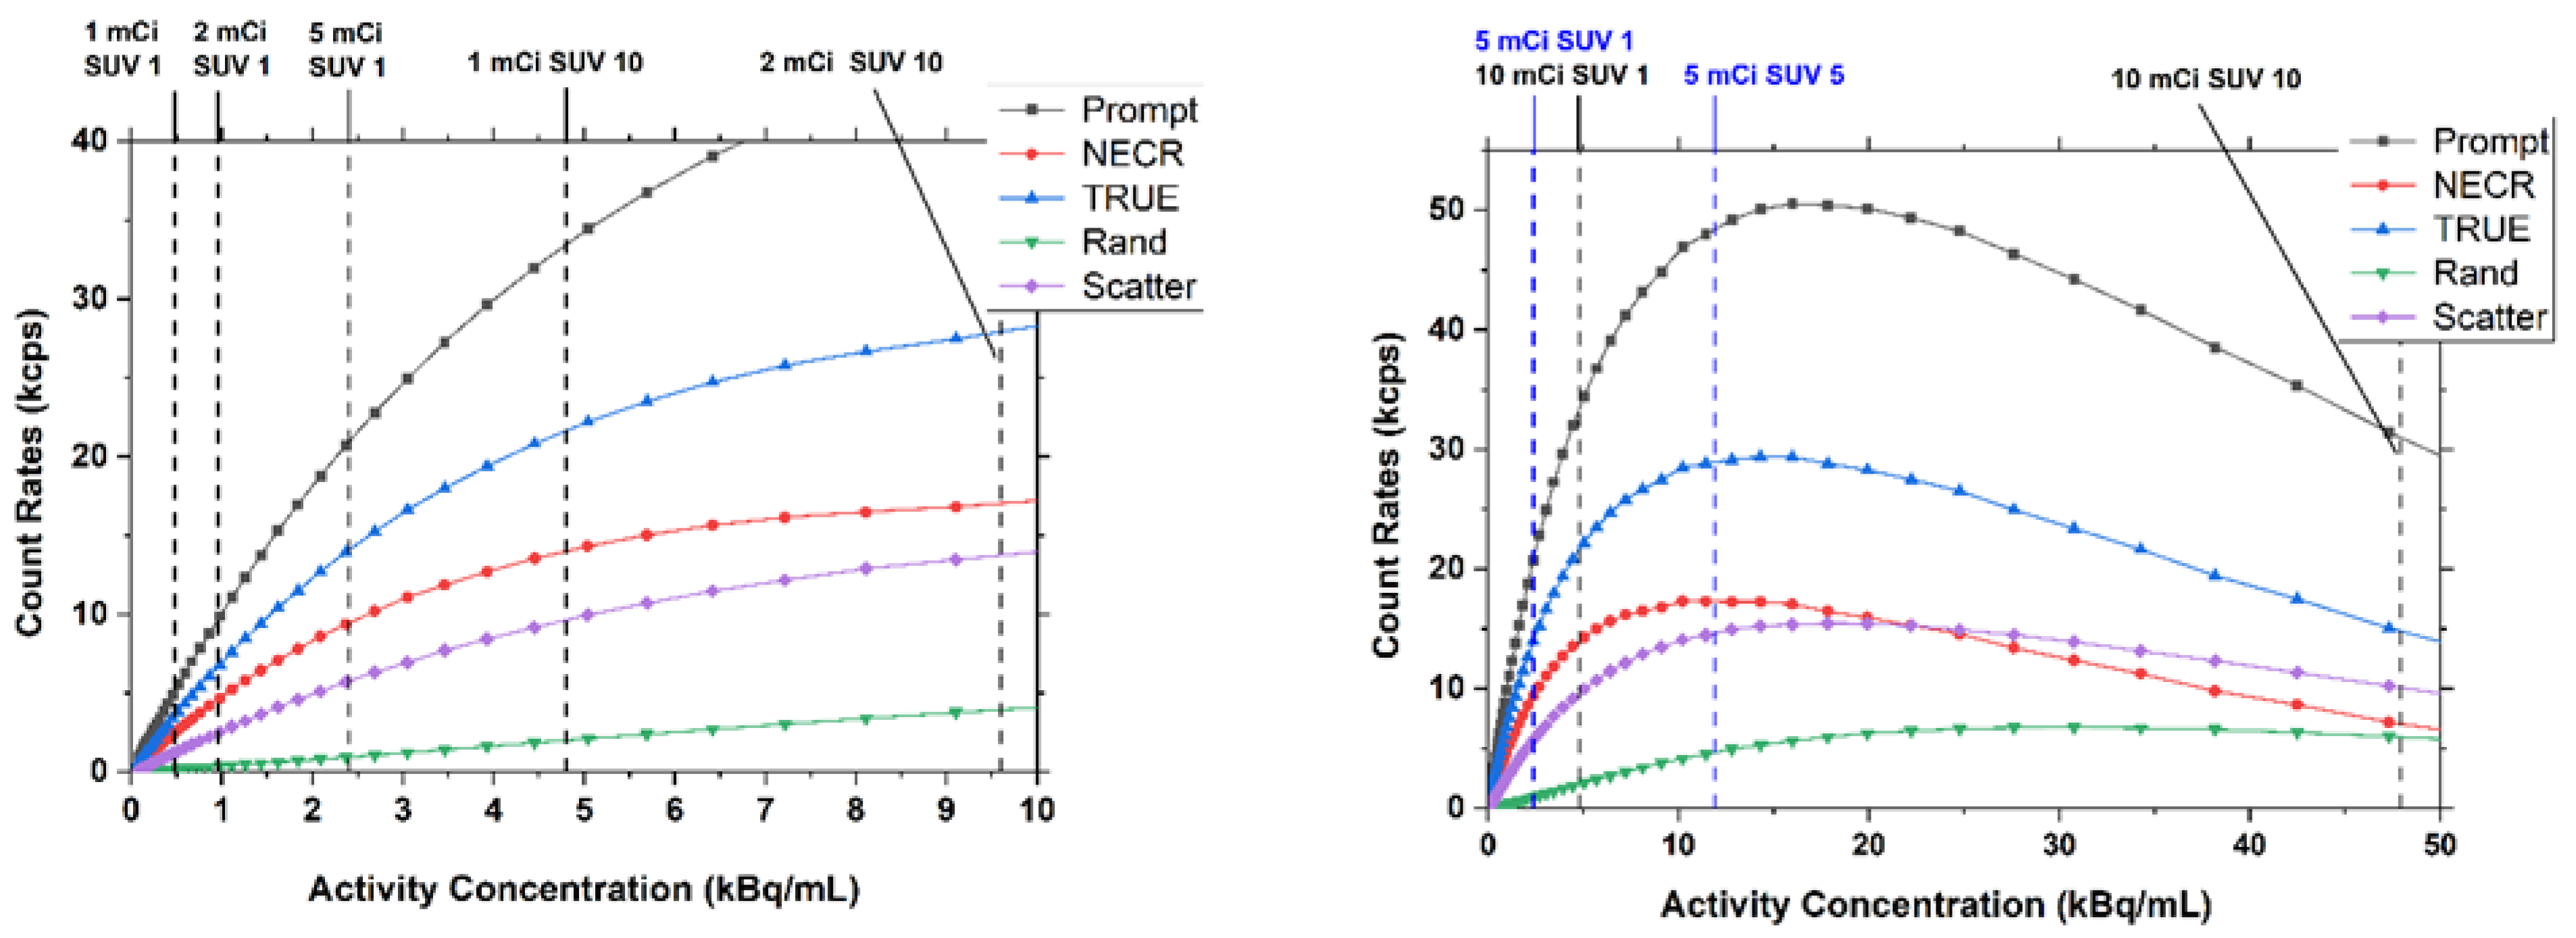
2.3. Count-Rate Performance
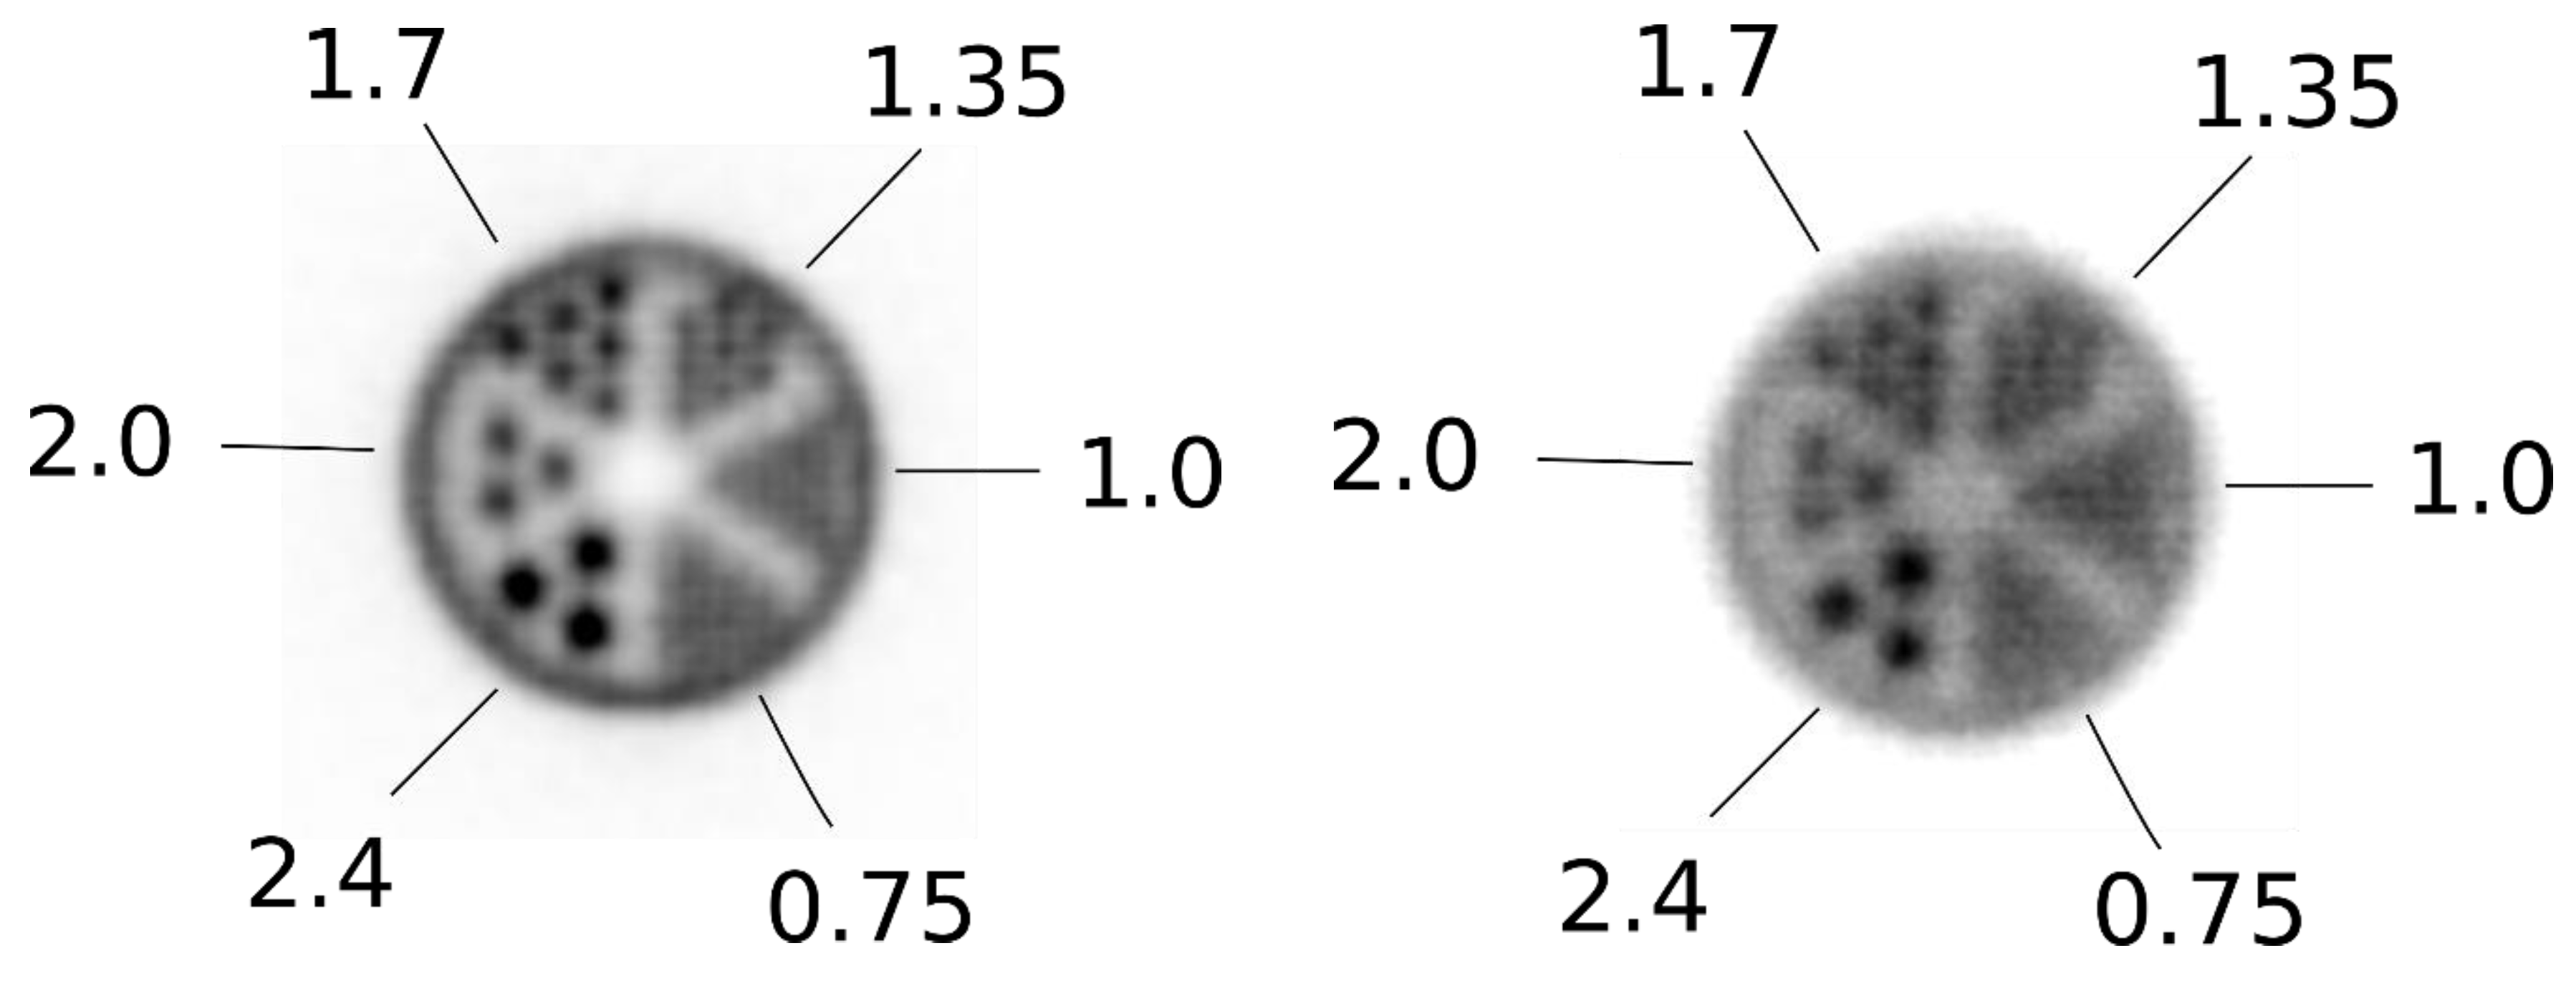
2.4. Clinical Imaging
3. Results
3.1. Spatial Resolution
3.2. Sensitivity
3.3. Count-Rate Performance
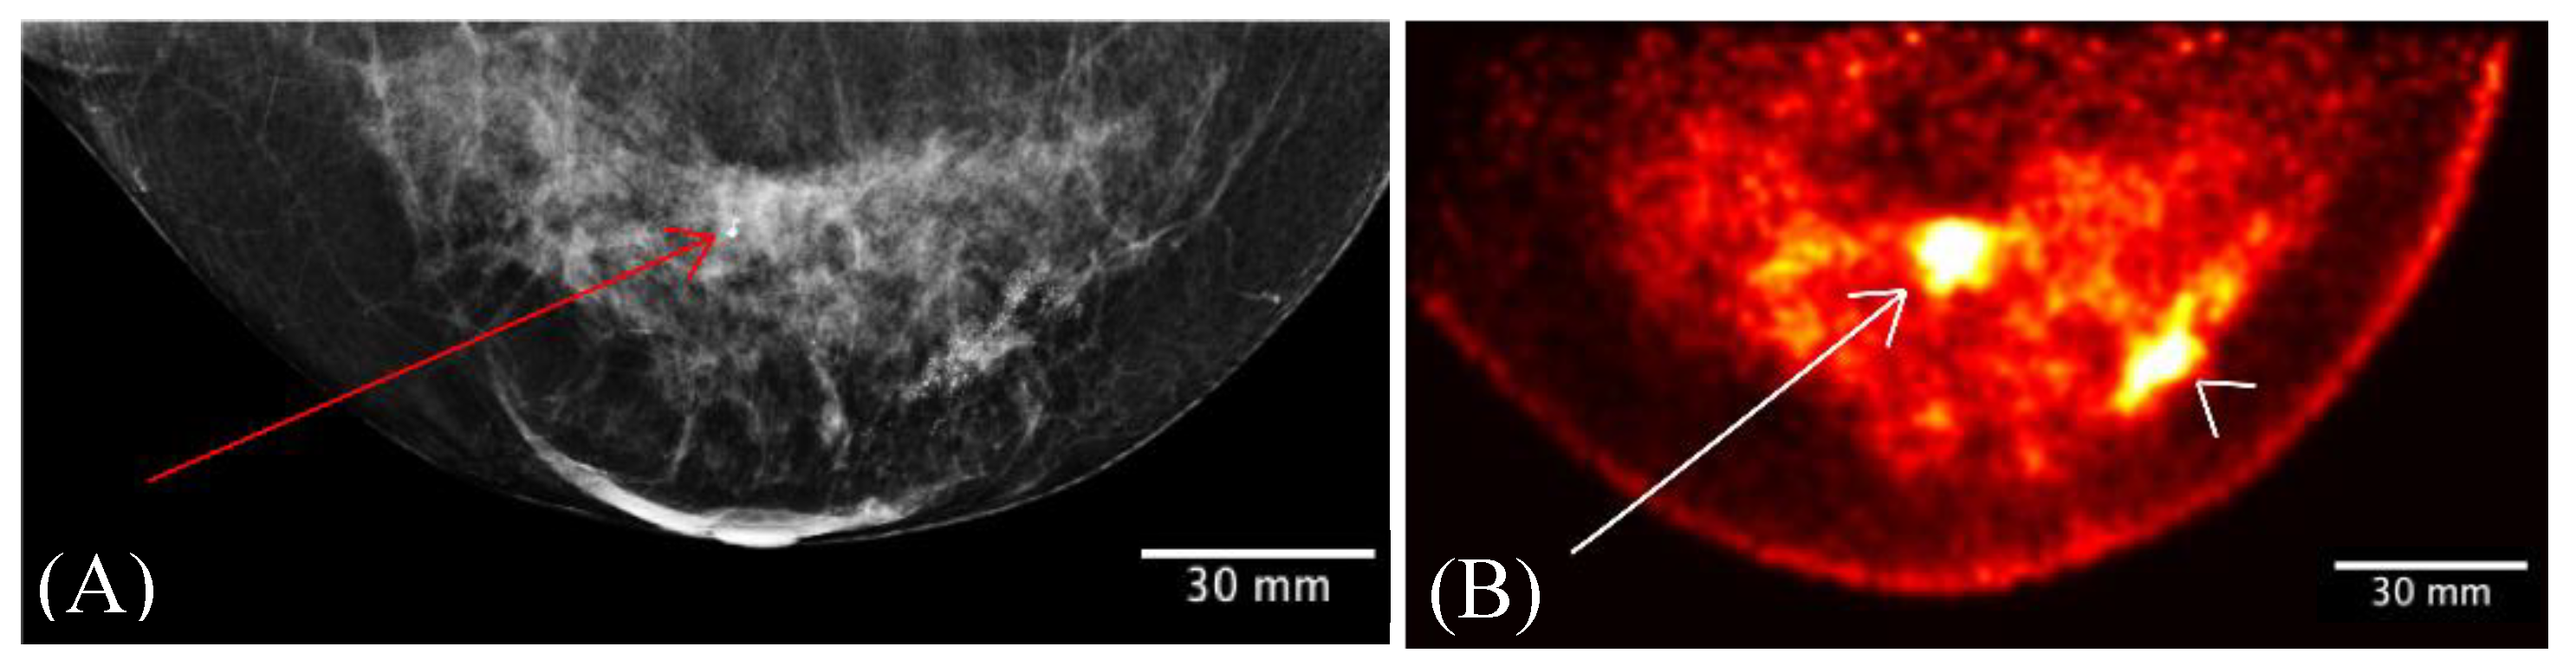
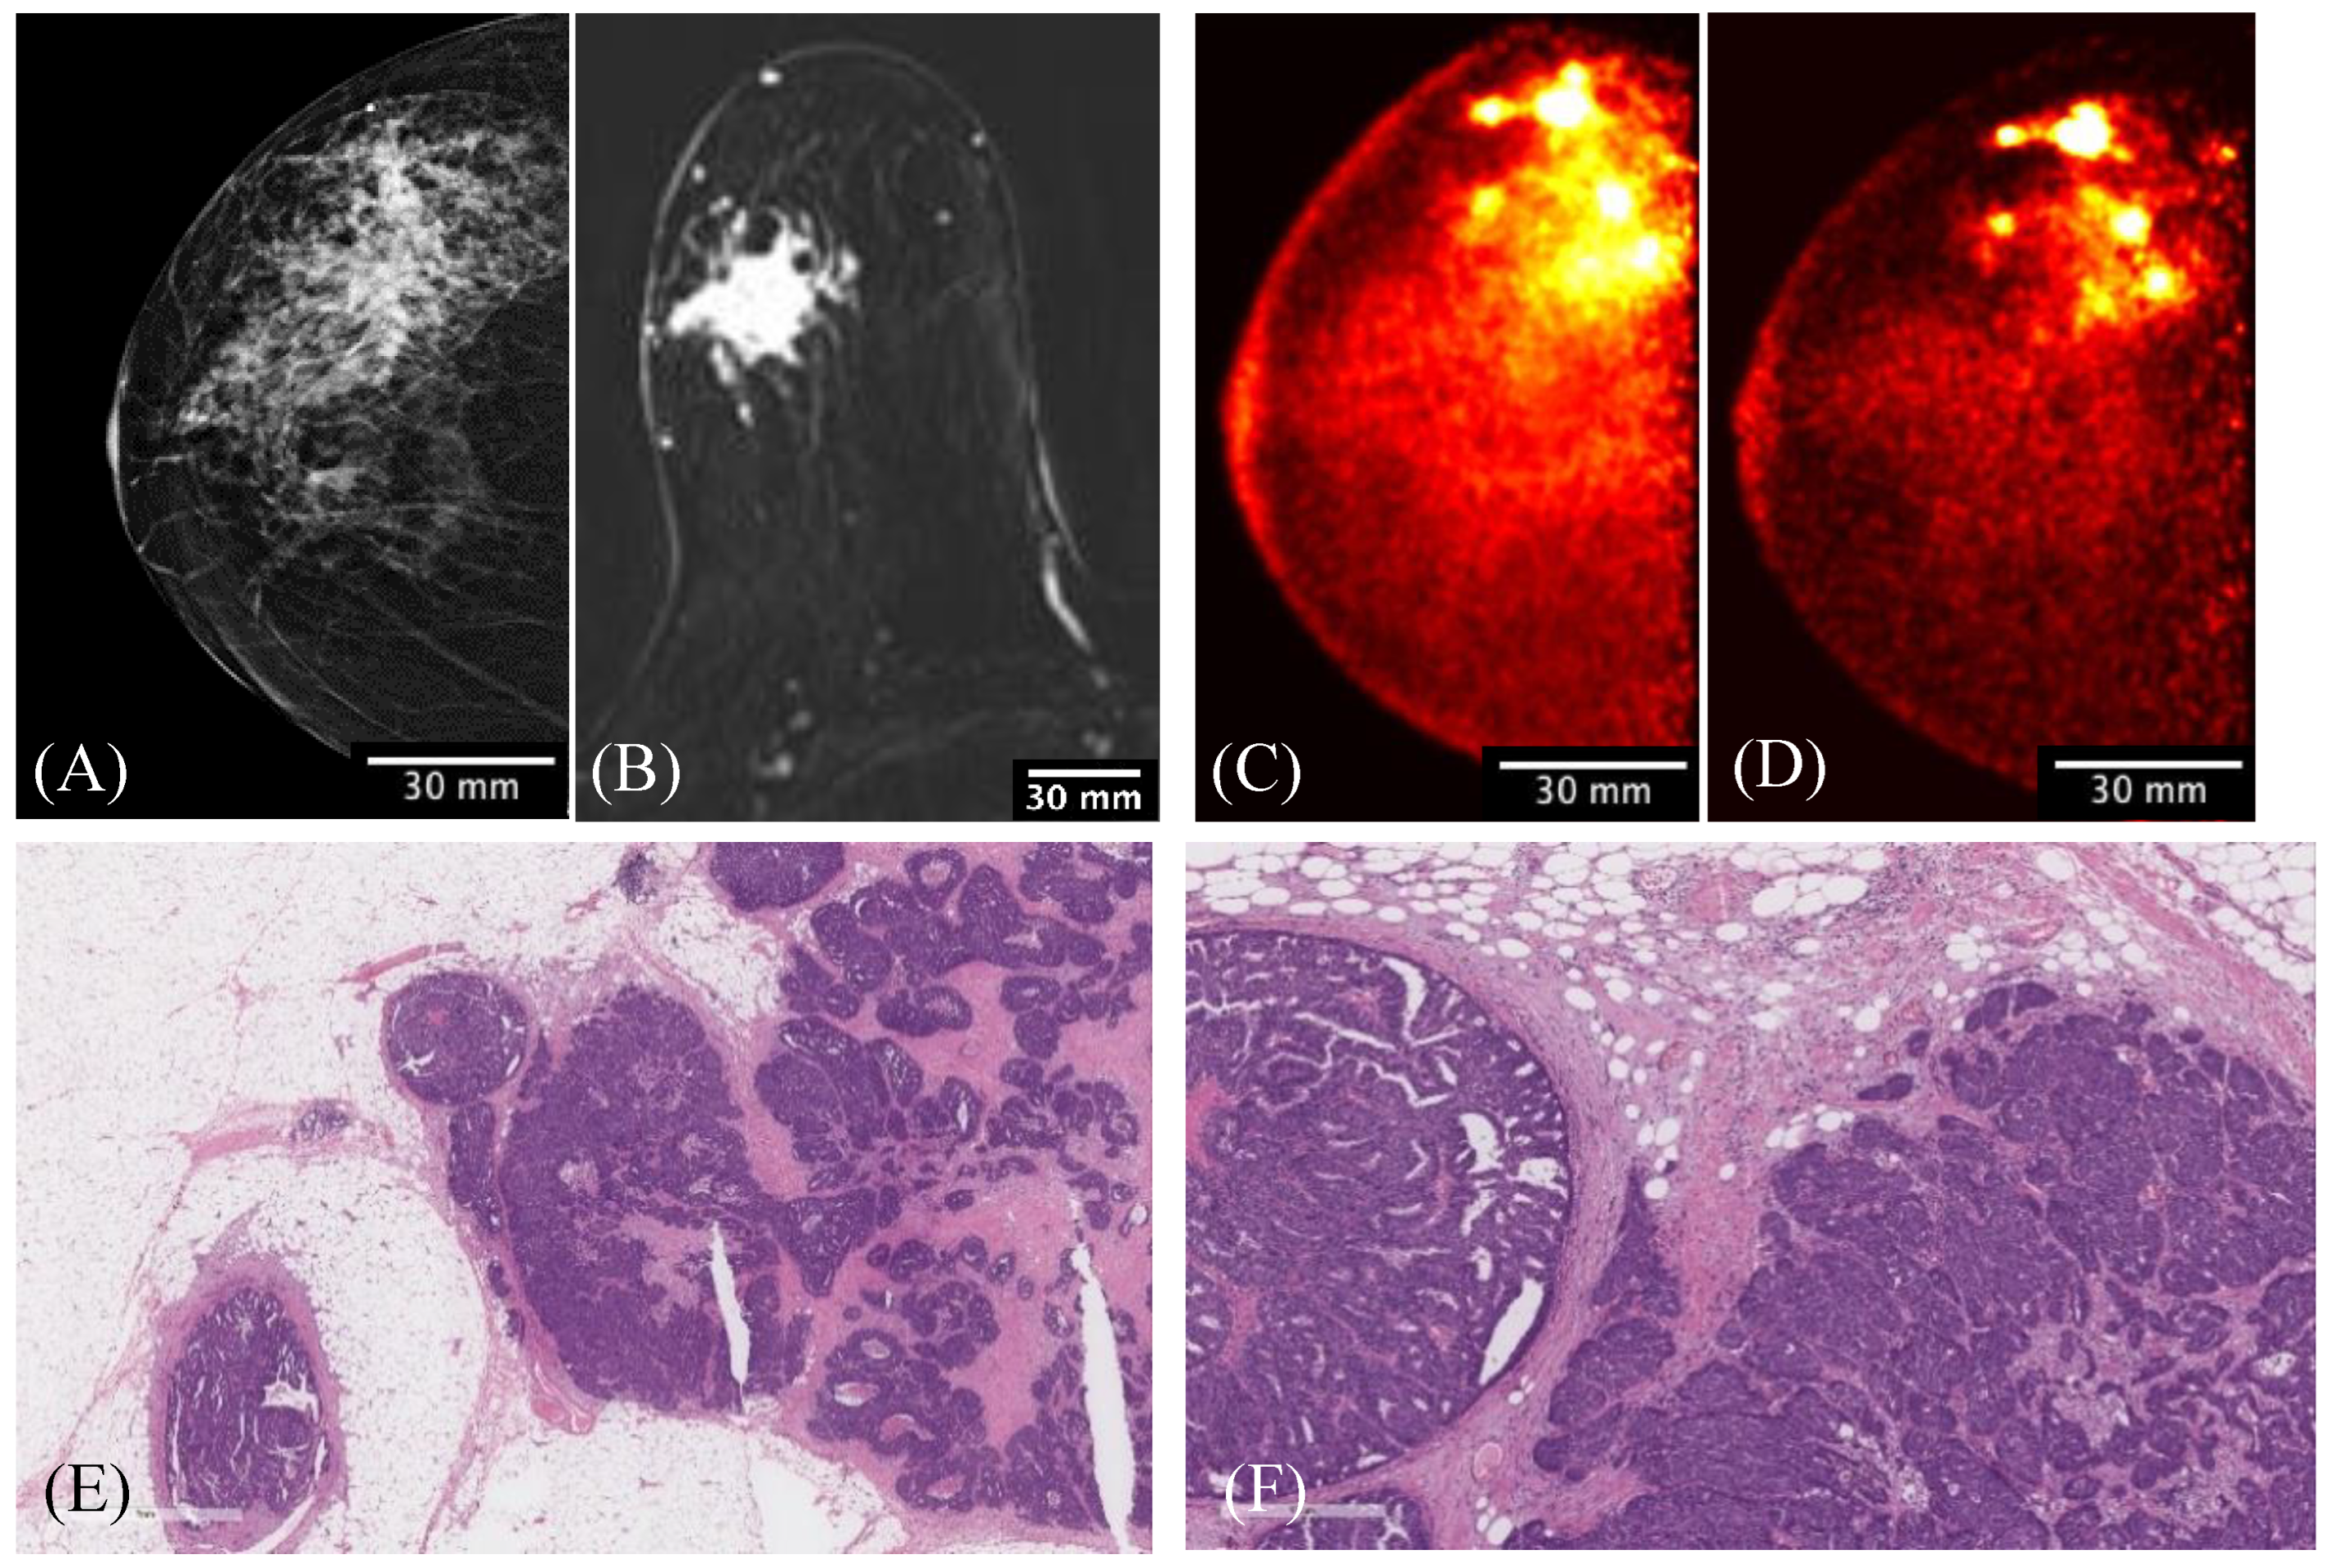
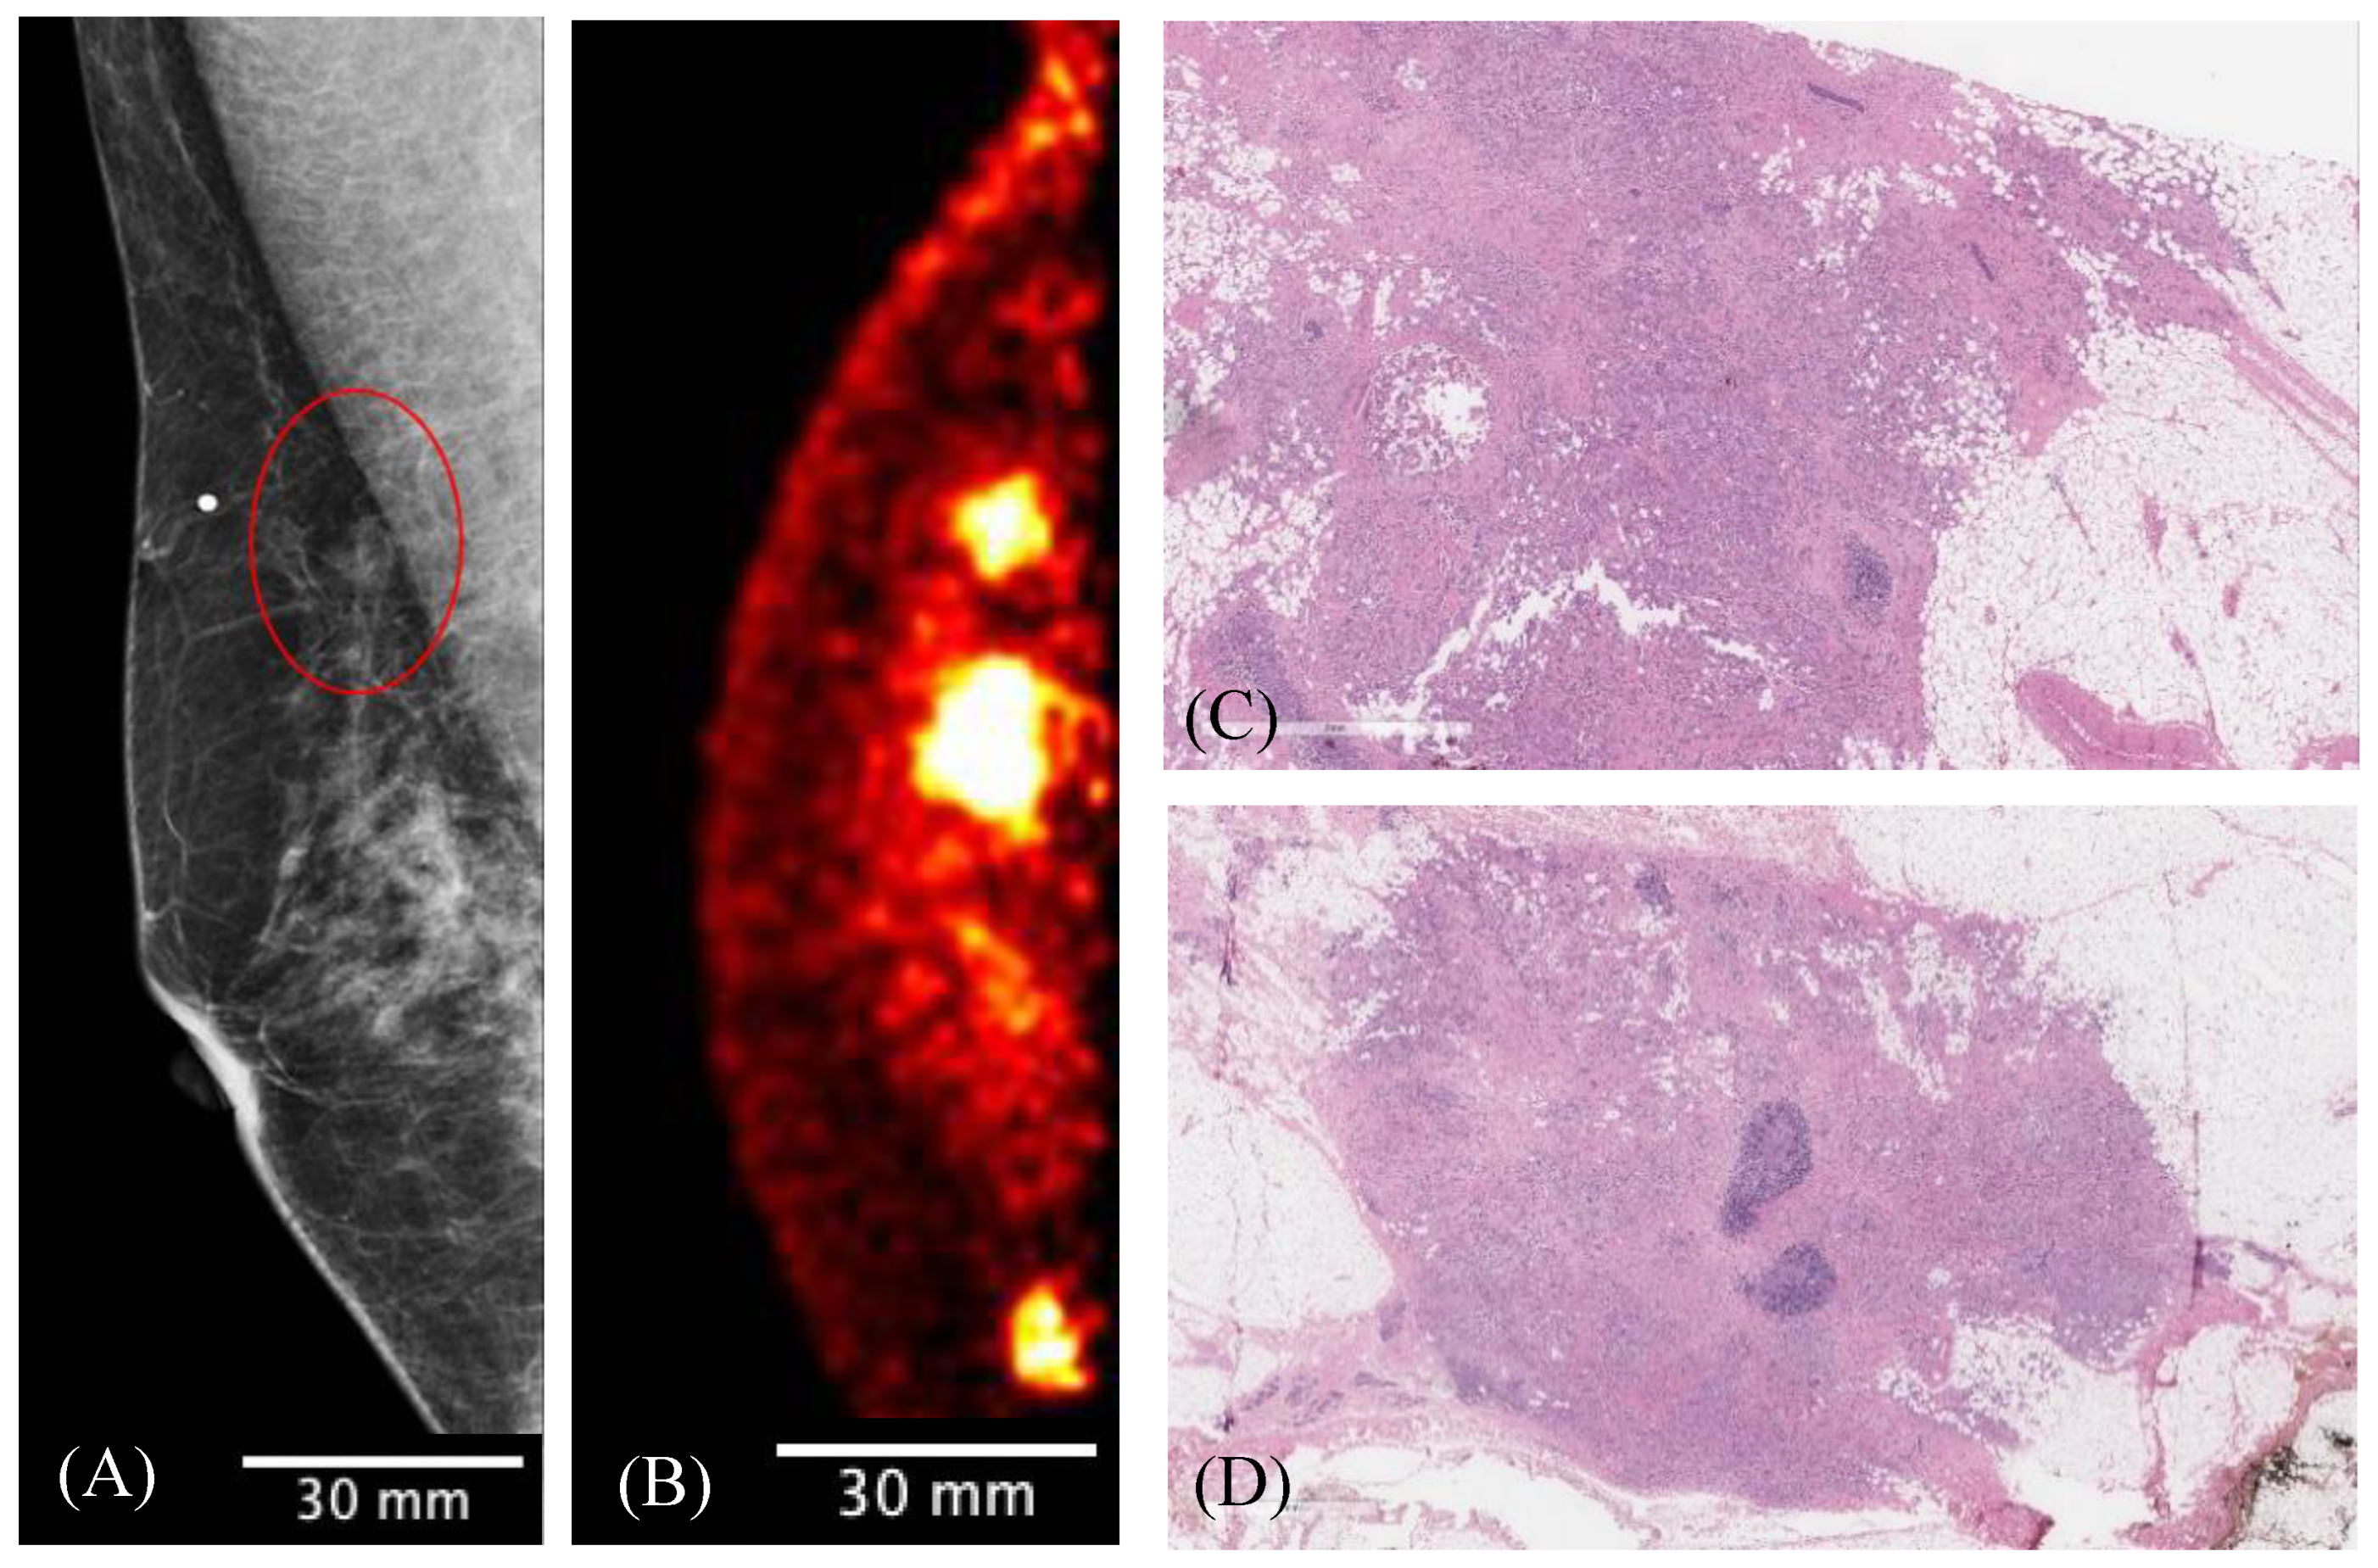
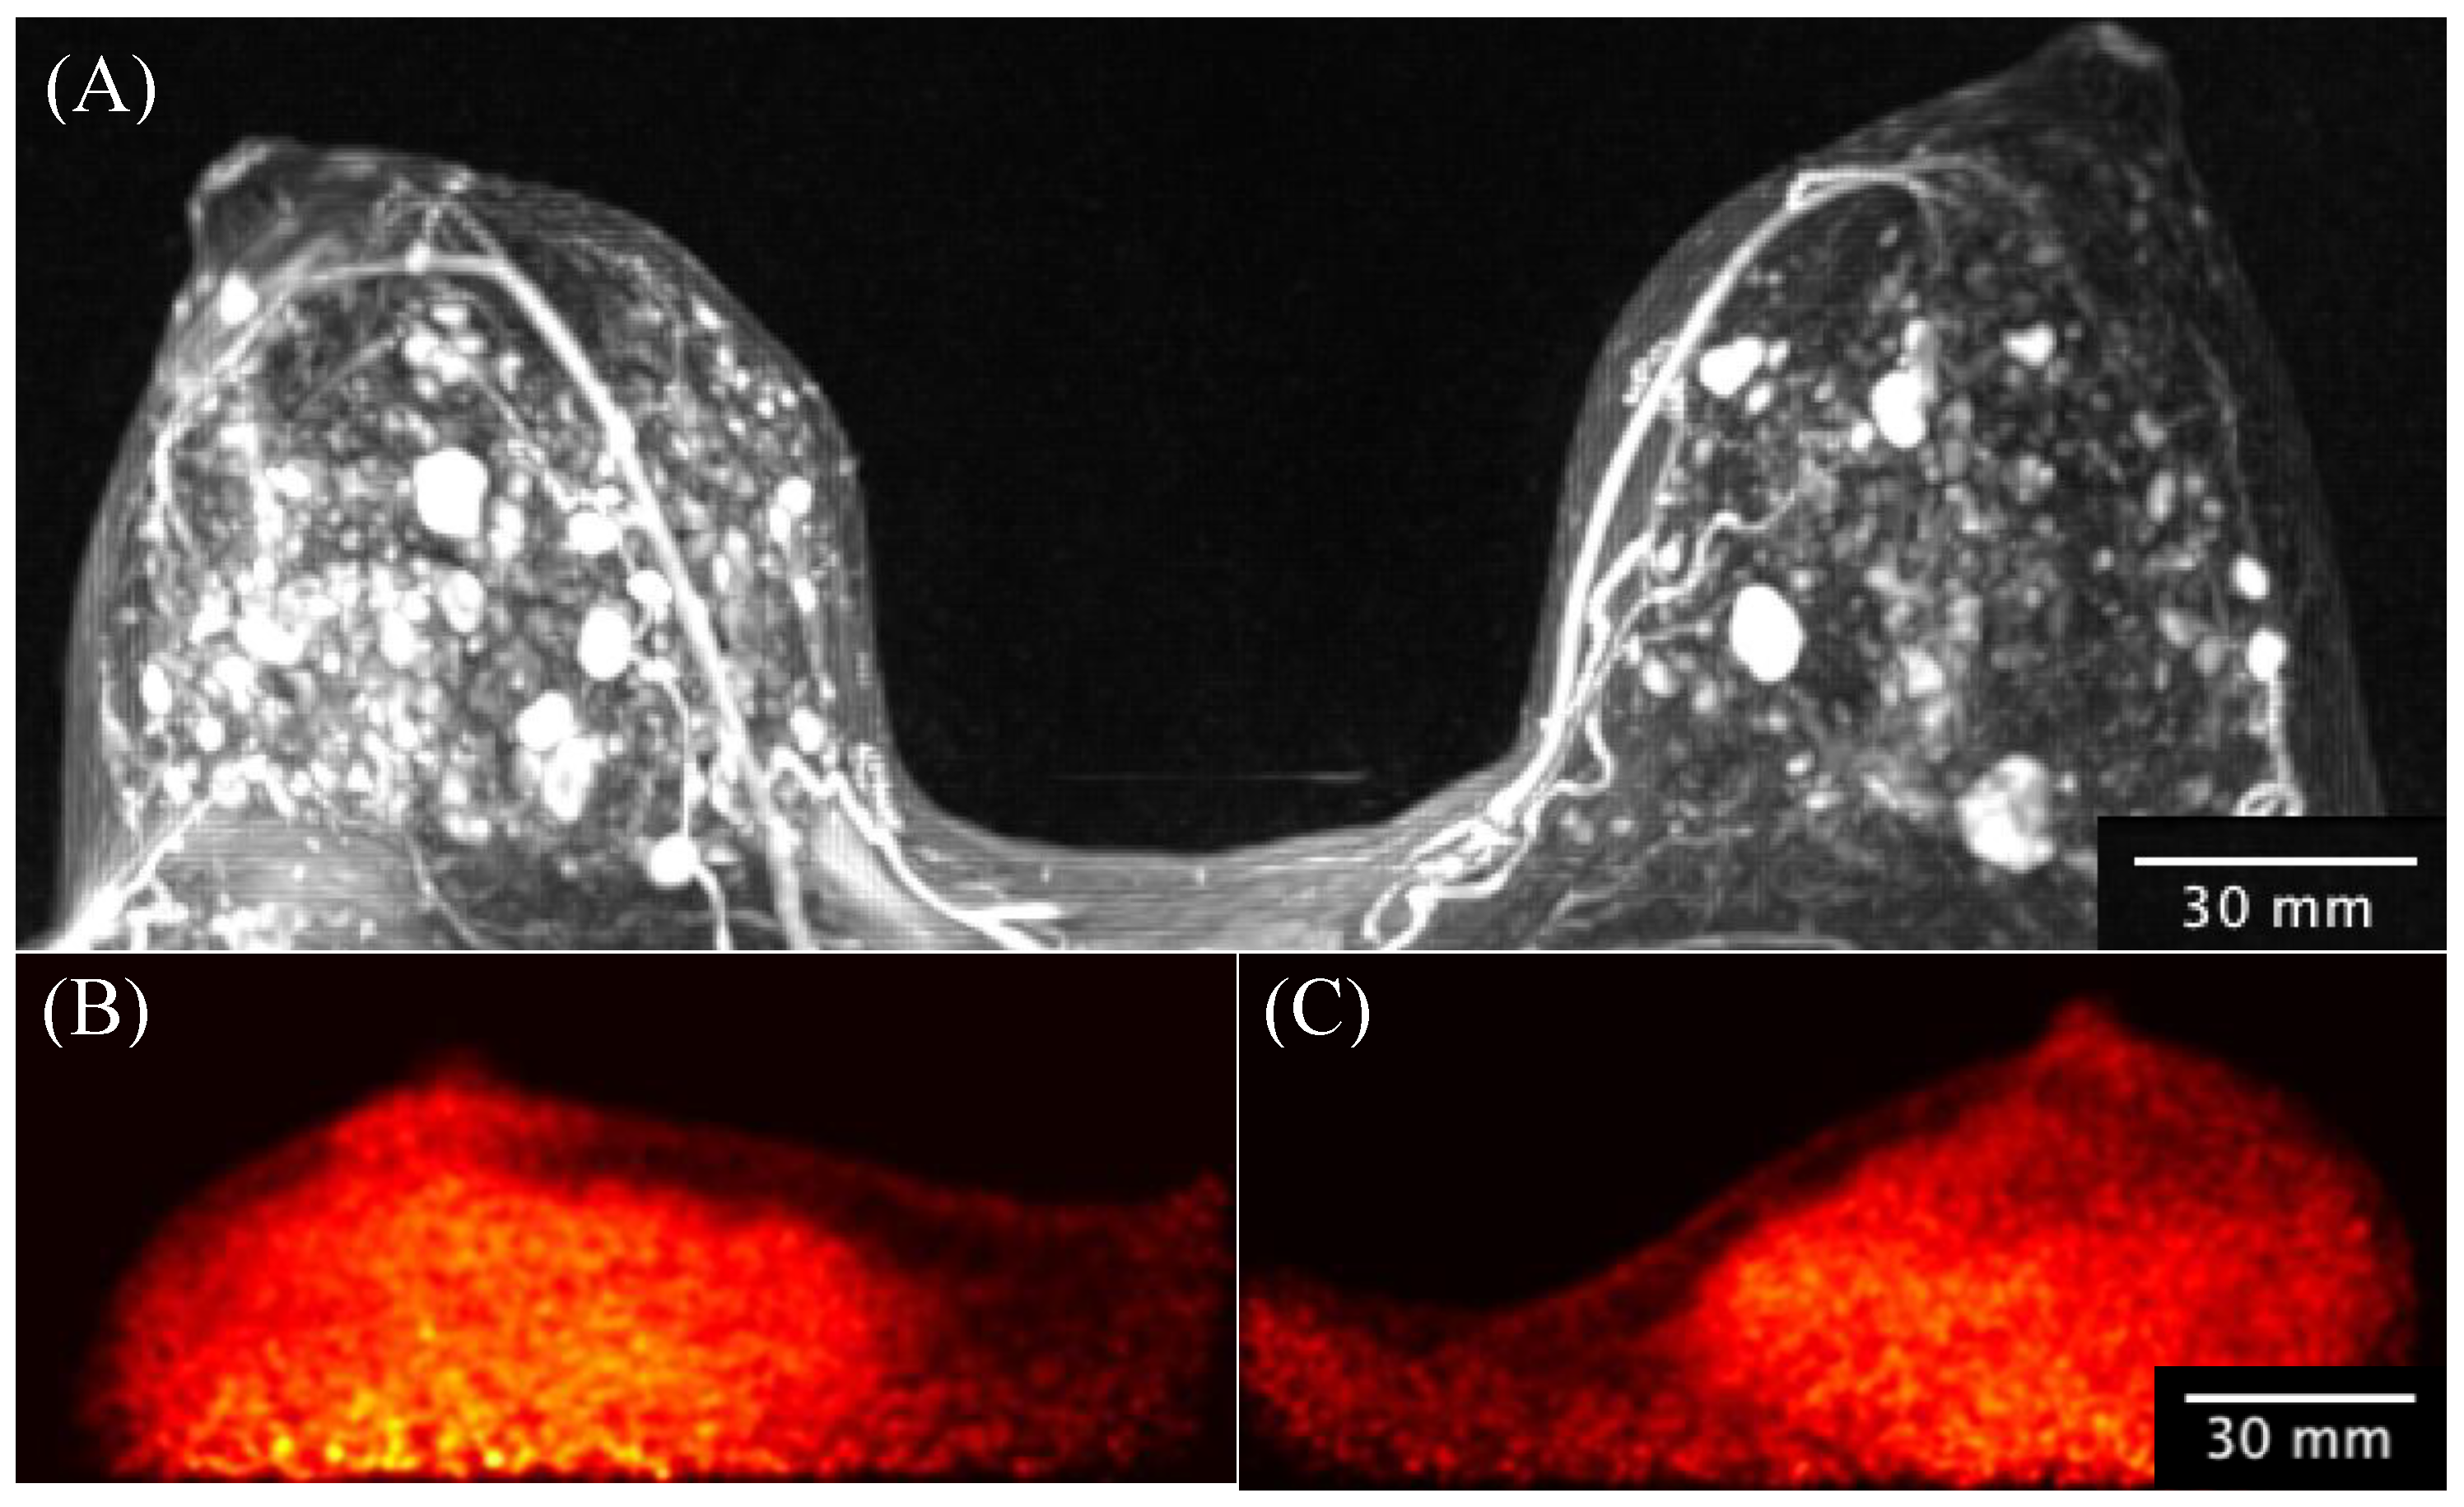
3.4. Clinical Imaging
4. Discussion
5. Conclusions
Author Contributions
Funding
Institutional Review Board Statement
Informed Consent Statement
Data Availability Statement
Acknowledgments
Conflicts of Interest
References
- Subramaniam, R.M. Precision Medicine and PET/Computed Tomography: Challenges and Implementation. PET Clin. 2017, 12, 1–5. [Google Scholar] [CrossRef] [PubMed] [Green Version]
- Miles, K.A.; Voo, S.A.; Groves, A.M. Additional Clinical Value for PET/MRI in Oncology: Moving Beyond Simple Diagnosis. J. Nucl. Med. 2018, 59, 1028–1032. [Google Scholar] [CrossRef]
- Subramaniam, R.M. Nuclear Medicine and Molecular Imaging—An Impactful Decade of Contributions to Patient Care and Driving Precision Medicine. Am. J. Roentgenol. 2017, 209, 241–242. [Google Scholar] [CrossRef]
- Wang, X.; Zhong, X.; Cheng, L. Titanium-based nanomaterials for cancer theranostics. Coord. Chem. Rev. 2021, 430, 213662. [Google Scholar] [CrossRef]
- Miyake, K.K.; Nakamoto, Y.; Togashi, K. Current Status of Dedicated Breast PET Imaging. Curr Radiol Rep. 2016, 4, 16. [Google Scholar] [CrossRef]
- Narayanan, D.; Berg, W.A. Use of Breast-Specific PET Scanners and Comparison with MR Imaging. Magn. Reson. Imaging Clin. North Am. 2018, 26, 265–272. [Google Scholar] [CrossRef]
- Hathi, D.K.; Li, W.; Seo, Y.; Flavell, R.R.; Kornak, J.; Franc, B.L.; Joe, B.N.; Esserman, L.J.; Hylton, N.M.; Jones, E.F. Evaluation of primary breast cancers using dedicated breast PET and whole-body PET. Sci. Rep. 2020, 10, 21930. [Google Scholar] [CrossRef] [PubMed]
- Moliner, L.; Rodríguez-Alvarez, M.J.; Catret, J.V.; González, A.; Ilisie, V.; Benlloch, J.M. NEMA Performance Evaluation of CareMiBrain dedicated brain PET and Comparison with the whole-body and dedicated brain PET systems. Sci. Rep. 2019, 9, 15484. [Google Scholar] [CrossRef] [PubMed] [Green Version]
- Nakamoto, R.; Nakamoto, Y.; Ishimori, T.; Nishimatsu, K.; Miyake, K.K.; Kanao, S.; Iima, M.; Toi, M.; Togashi, K. Diagnostic performance of a novel dedicated breast PET scanner with C-shaped ring detectors. Nucl. Med. Commun. 2017, 38, 388–395. [Google Scholar] [CrossRef]
- Hernández, T.G.; González, A.V.; Rebolleda, J.F.; Jurado, R.S.; Ferrando, J.R.; González, L.B.; Cabañero, D.G.; Santiago, M.D.P.C. Performance evaluation of a high resolution dedicated breast PET scanner. Med. Phys. 2016, 43, 2261. [Google Scholar] [CrossRef]
- Hruska, C.B.; O’Connor, M.K. Curies, and Grays, and Sieverts, Oh My: A Guide for Discussing Radiation Dose and Risk of Molecular Breast Imaging. J. Am. Coll. Radiol. 2015, 12, 1103–1105. [Google Scholar] [CrossRef] [Green Version]
- Rehani, M.M.; Brady, Z. Contemporary issues in radiation protection in medical imaging: Introductory editorial. Br. J. Radiol. 2021, 94, bjr20219004. [Google Scholar] [CrossRef]
- Weber, W.A.; Czernin, J.; Anderson, C.J.; Badawi, R.D.; Barthel, H.; Bengel, F.; Bodei, L.; Buvat, I.; DiCarli, M.; Graham, M.M.; et al. The Future of Nuclear Medicine, Molecular Imaging, and Theranostics. J. Nucl. Med. 2020, 61, 263S–272S. [Google Scholar] [CrossRef]
- Gonzalez, A.J.; Sanchez, F.; Benlloch, J.M. Organ-Dedicated Molecular Imaging Systems. IEEE Trans. Radiat. Plasma Med. Sci. 2018, 2, 388–403. [Google Scholar] [CrossRef]
- Hendrick, R.E. Radiation doses and cancer risks from breast imaging studies. Radiology 2010, 257, 246–253. [Google Scholar] [CrossRef] [Green Version]
- Catana, C. The Dawn of a New Era in Low-Dose PET Imaging. Radiology 2019, 290, 657–658. [Google Scholar] [CrossRef] [PubMed]
- O’Connor, M.K.; Li, H.; Rhodes, D.J.; Hruska, C.B.; Clancy, C.B.; Vetter, R.J. Comparison of radiation exposure and associated radiation-induced cancer risks from mammography and molecular imaging of the breast. Med. Phys. 2010, 37, 6187–6198. [Google Scholar] [CrossRef] [PubMed] [Green Version]
- Reznik, A.; Bubon, O.; Teymurazyan, A. Tileable Block Detectors for Seamless Block Detector Arrays in Positron Emission Mammography. WIPO Patent WO2017/143442A1, 31 August 2017. [Google Scholar]
- Poladyan, H.; Bubon, O.; Teymurazyan, A.; Senchurov, S.; Reznik, A. Gaussian position-weighted center of gravity algorithm for multiplexed readout. Phys. Med. Biol. 2020, 65, 165003. [Google Scholar] [CrossRef] [PubMed]
- Poladyan, H.; Bubon, O.; Teymurazyan, A.; Senchurov, S.; Reznik, A. Gain invariant coordinate reconstruction for SiPM-Based pixelated gamma detectors with multiplexed readout. IEEE Trans. Instrum. Meas. 2020, 69, 4281–4291. [Google Scholar] [CrossRef]
- Anger, H.O. Scintillation Camera with Multichannel Collimators. Ucrl-11387; UCRL [reports]; U.S. Atomic Energy Commission: Washington, DC, USA, 1964; Volume 31, pp. 70–86.
- Shepp, L.A.; Vardi, Y. Maximum Likelihood Reconstruction for Emission Tomography. IEEE Trans. Med. Imaging. 1982, 1, 113–122. [Google Scholar] [CrossRef]
- Alenius, S.; Ruotsalainen, U. Bayesian image reconstruction for emission tomography based on median root prior. Eur. J. Nucl. Med. 1997, 24, 258–265. [Google Scholar]
- NEMA NU 4-2008; Performance Measurements of Small Animal Positron Emission Tomographs. National Electrical Manufacturer’s Association: Rosslyn, VA, USA, 2008.
- Daube-Witherspoon, M.E.; Muehllehner, G. Treatment of axial data in three-dimensional PET. J. Nucl. Med. 1987, 28, 1717–1724. [Google Scholar]
- Hallen, P.; Schug, D.; Schulz, V. Comments on the NEMA NU 4-2008 Standard on Performance Measurement of Small Animal Positron Emission Tomographs. EJNMMI Phys. 2020, 7, 12. [Google Scholar] [CrossRef]
- Schneider, C.A.; Rasband, W.S.; Eliceiri, K.W. NIH Image to ImageJ: 25 years of image analysis. Nat. Methods. 2012, 9, 671–675. [Google Scholar] [CrossRef] [PubMed]
- Weissler, B.; Gebhardt, P.; Lerche, C.W.; Wehner, J.; Solf, T.; Goldschmidt, B.; Mackewn, J.E.; Marsden, P.K.; Kiessling, F.; Perkuhn, M.; et al. MR compatibility aspects of a silicon photomultiplier-based PET/RF insert with integrated digitisation. Phys. Med. Biol. 2014, 59, 5119–5139. [Google Scholar] [CrossRef] [PubMed]
- MacDonald, L.; Edwards, J.; Lewellen, T.; Haseley, D.; Rogers, J.; Kinahan, P. Clinical Imaging Characteristics of the Positron Emission Mammography Camera: PEM Flex Solo II. J. Nucl. Med. 2009, 50(10), 1666–1675. [Google Scholar] [CrossRef] [Green Version]
- Smith, M.F.; Majewski, S.; Raylman, R.R. Positron Emission Mammography with Multiple Angle Acquisition. IEEE Nucl. Sci. Symp. Med. Imaging Conf. 2002, 3, 1892–1896. [Google Scholar]
- Evaluating Positron Emission Mammography Imaging of Suspicious Breast Abnormalities. Clinical Trial. Identifier: NCT03520218. Available online: https://clinicaltrials.gov/ct2/show/NCT03520218 (accessed on 2 June 2022).
- Boellaard, R.; Delgado-Bolton, R.; Oyen, W.J.G.; Giammarile, F.; Tatsch, K.; Eschner, W.; Verzijlbergen, F.J.; Barrington, S.F.; Pike, L.C.; Weber, W.A.; et al. FDG PET/CT: EANM procedure guidelines for tumour imaging: Version 2.0. Eur. J. Nucl. Med. Mol. Imaging 2015, 42, 328–354. [Google Scholar] [CrossRef]
- Jones, T.; Townsend, D.W. History and future technical innovation in positron emission tomography. J. Med. Imaging 2017, 4, 011013. [Google Scholar] [CrossRef] [PubMed]
- Sanaat, A.; Shiri, I.; Arabi, H.; Mainta, I.; Nkoulou, R.; Zaidi, H. Deep learning-assisted ultra-fast/low-dose whole-body PET/CT imaging. Eur. J. Nucl. Med. Mol. Imaging 2021, 48, 2405–2415. [Google Scholar] [CrossRef]
- Chaudhari, A.S.; Mittra, E.; Davidzon, G.A.; Gulaka, P.; Gandhi, H.; Brown, A.; Zhang, T.; Srinivas, S.; Gong, E.; Zaharchuk, G.; et al. Low-count whole-body PET with deep learning in a multicenter and externally validated study. npj Digit. Med. 2021, 4, 127. [Google Scholar] [CrossRef]
- Xing, Y.; Qiao, W.; Wang, T.; Wang, Y.; Li, C.; Lv, Y.; Xi, C.; Liao, S.; Qian, Z.; Zhao, J. Deep learning-assisted PET imaging achieves fast scan/low-dose examination. EJNMMI Phys. 2022, 9, 7. [Google Scholar] [CrossRef]
- Schaefferkoetter, J.; Nai, Y.H.; Reilhac, A.; Townsend, D.W.; Eriksson, L.; Conti, M. Low dose positron emission tomography emulation from decimated high statistics: A clinical validation study. Med. Phys. 2019, 46, 2638–2645. [Google Scholar] [CrossRef] [PubMed]
- Pisano, E.D.; Gatsonis, C.; Hendrick, E.; Yaffe, M.; Baum, J.K.; Acharyya, S.; Conant, E.F.; Fajardo, L.L.; Bassett, L.; D’Orsi, C.; et al. Diagnostic performance of digital versus film mammography for breast-cancer screening. N. Engl. J. Med. 2005, 353, 1773–1783. [Google Scholar] [CrossRef] [PubMed]
- National Cancer Institute Breast Cancer Surveillance Consortium. Distribution of Key Variables: BI-RADS Breast Density. The Breast Cancer Surveillance Consortium and its data collection and sharing activities are funded by grants from the National Cancer Institute (P01CA154292, U54CA163303), Patient-Centered Outcomes Research Institute (PCS-1504-30370), and Agency for Health Research and Quality (R01 HS018366-01A1). Breast Cancer Surveillance Consortium. 2014. Available online: http://www.bcsc-research.org/ (accessed on 2 June 2022).
- Fowler, A.M. A molecular approach to breast imaging. J. Nucl. Med. 2014, 55, 177–180. [Google Scholar] [CrossRef] [PubMed] [Green Version]
- Caldarella, C.; Treglia, G.; Giordano, A. Diagnostic performance of dedicated positron emission mammography using fluorine-18-fluorodeoxyglucose in women with suspicious breast lesions: A meta-analysis. Clin. Breast Cancer. 2014, 14, 241–248. [Google Scholar] [CrossRef]
- Reynes-Llompart, G.; Gamez-Cenzano, C.; Romero-Zayas, I.; Bel, L.R.; Conejero, J.L.V.; Martí-Climent, J. Performance characteristics of the whole-body discovery IQ PET/CT system. J. Nucl. Med. 2017, 58, 1155–1161. [Google Scholar] [CrossRef]
- Delso, G.; Fürst, S.; Jakoby, B.; Ladebeck, R.; Ganter, C.; Nekolla, S.G.; Schwaiger, M.; Ziegler, S.I. Performance Measurements of the Siemens mMR Integrated Whole-Body PET/MR Scanner. J. Nucl. Med. 2011, 52, 1914–1922. [Google Scholar] [CrossRef] [Green Version]
- Luo, W.; Anashkin, E.; Matthews, C.G. Performance evaluation of a PEM scanner using the NEMA NU 4-2008 small animal PET standards. IEEE Trans. Nucl. Sci. 2010, 57, 94–103. [Google Scholar] [CrossRef]
- Hruska, C.B.; O’Connor, M.K. Nuclear imaging of the breast: Translating achievements in instrumentation into clinical use. Med. Phys. 2013, 40, 050901. [Google Scholar] [CrossRef]
- Schilling, K.; Narayanan, D.; Kalinyak, J.E. Effect of Breast Density, Menopausal Status, and Hormone Use in High Resolution Positron Emission Mammography. In Proceedings of the RSNA 2008: 94th Scientific Assembly and Annual Meeting of the Radiological Society of North America, Chicago, IL, USA, 30 November–5 December 2008. [Google Scholar]
- Teixeira, S.C.; Rebolleda, J.F.; Koolen, B.B.; Wesseling, J.; Jurado, R.S.; Stokkel, M.P.M.; Santiago, M.D.P.C.; van der Noort, V.; Rutgers, E.J.T.; Olmos, R.A.V. Evaluation of a hanging-breast PET system for primary tumor visualization in patients with stage I-III breast cancer: Comparison with standard PET/CT. Am. J. Roentgenol. 2016, 206, 1307–1314. [Google Scholar] [CrossRef] [PubMed]
- Moliner, L.; González, A.J.; Soriano, A.; Sánchez, F.; Correcher, C.; Orero, A.; Carles, M.; Vidal, L.F.; Barberá, J.; Caballero, L.; et al. Design and evaluation of the MAMMI dedicated breast PET. Med. Phys. 2012, 39, 5393–5404. [Google Scholar] [CrossRef] [PubMed]
- Soriano, A.; Sánchez, F.; Carrilero, V.; Pardo, A.; Vidal, L.; Vázquez, C.; Barberá, J.; Seimetz, M.; Rodríguez-Alvarez, M.; Rigla, J.; et al. Performance evaluation of the dual ring MAMMI breast PET. In Proceedings of the 2013 IEEE Nuclear Science Symposium and Medical Imaging Conference (2013 NSS/MIC), Seoul, Korea, 27 October–2 November 2013; pp. 13–16. [Google Scholar]
- Vandenberghe, S.; Moskal, P.; Karp, J.S. State of the art in total body PET. EJNMMI Phys. 2020, 7, 35. [Google Scholar] [CrossRef] [PubMed]
- Prenosil, G.A.; Sari, H.; Fürstner, M.; Afshar-Oromieh, A.; Shi, K.; Rominger, A.; Hentschel, M. Performance Characteristics of the Biograph Vision Quadra PET/CT system with long axial field of view using the NEMA NU 2-2018 Standard. J. Nucl. Med. 2021, 121, 261972. [Google Scholar] [CrossRef] [PubMed]
- Pan, T.; Einstein, S.A.; Kappadath, S.C.; Grogg, K.S.; Gomez, C.L.; Alessio, A.M.; Hunter, W.C.; El Fakhri, G.; Kinahan, P.; Mawlawi, O.R. Performance evaluation of the 5-Ring GE Discovery MI PET/CT system using the national electrical manufacturers association NU 2-2012 Standard. Med. Phys. 2019, 46, 3025–3033. [Google Scholar] [CrossRef]
- Miller, M.A. Focusing on high performance. In Advanced Molecular Imaging: Vereos PET/CT; Product Content White Paper; Philips Medical: Amsterdam, The Netherlands, 2016. [Google Scholar]
- Grant, A.M.; Deller, T.W.; Khalighi, M.M.; Maramraju, S.H.; Delso, G.; Levin, C.S. NEMA NU 2-2012 performance studies for the SiPM-based ToF-PET component of the GE SIGNA PET/MR system. Med. Phys. 2016, 43, 2334–2343. [Google Scholar] [CrossRef] [Green Version]
- Van Sluis, J.J.; De Jong, J.; Schaar, J.; Noordzij, W.; Van Snick, P.; Dierckx, R.; Borra, R.; Willemsen, A.; Boellaard, R. Performance characteristics of the digital biograph vision PET/CT system. J. Nucl. Med. 2019, 60, 1031–1036. [Google Scholar] [CrossRef]
- Macdonald, L.R.; Hippe, D.S.; Bender, L.C.; Cotter, E.W.; Voria, P.R.; Hallam, P.S.; Wang, C.L.; Haseley, D.R.; Kelly, M.M.; Parikh, J.R.; et al. Positron emission mammography image interpretation for reduced image count levels. J. Nucl. Med. 2016, 57, 348–354. [Google Scholar] [CrossRef]
- Ganguli, I.; Keating, N.L.; Thakore, N.; Lii, J.; Raza, S.; Pace, L.E. Downstream Mammary and Extramammary Cascade Services and Spending Following Screening Breast Magnetic Resonance Imaging vs Mammography Among Commercially Insured Women. JAMA Netw. Open 2022, 1, e227234. [Google Scholar] [CrossRef]
- Cherry, S.R.; Phelps, M.E. Positron emission tomography: Methods and instrumentation. In Diagnostic Nuclear Medicine, 3rd ed.; Sandler, M.P., Coleman, R.E., Wackers, F.J.T., Patton, J.A., Gottschalk, A., Hoffer, P.B., Eds.; Williams & Wilkins: Baltimore, MD, USA, 1996; pp. 139–159. [Google Scholar]
- Hoffman, E.J.; Phelps, M.E. Positron emission tomography: Principles and quantification. In Positron Emission Tomography and Autoradiography: Principles and Applications for the Brain and Heart; Phelps, M.E., Mazziotta, J.C., Schelbert, R.H., Eds.; Raven: New York, NY, USA, 1986. [Google Scholar]


| X-Axis | Y-Axis | |||
|---|---|---|---|---|
| Resolution at Z = 0 mm | FWHM | FWTM | FWHM | FWTM |
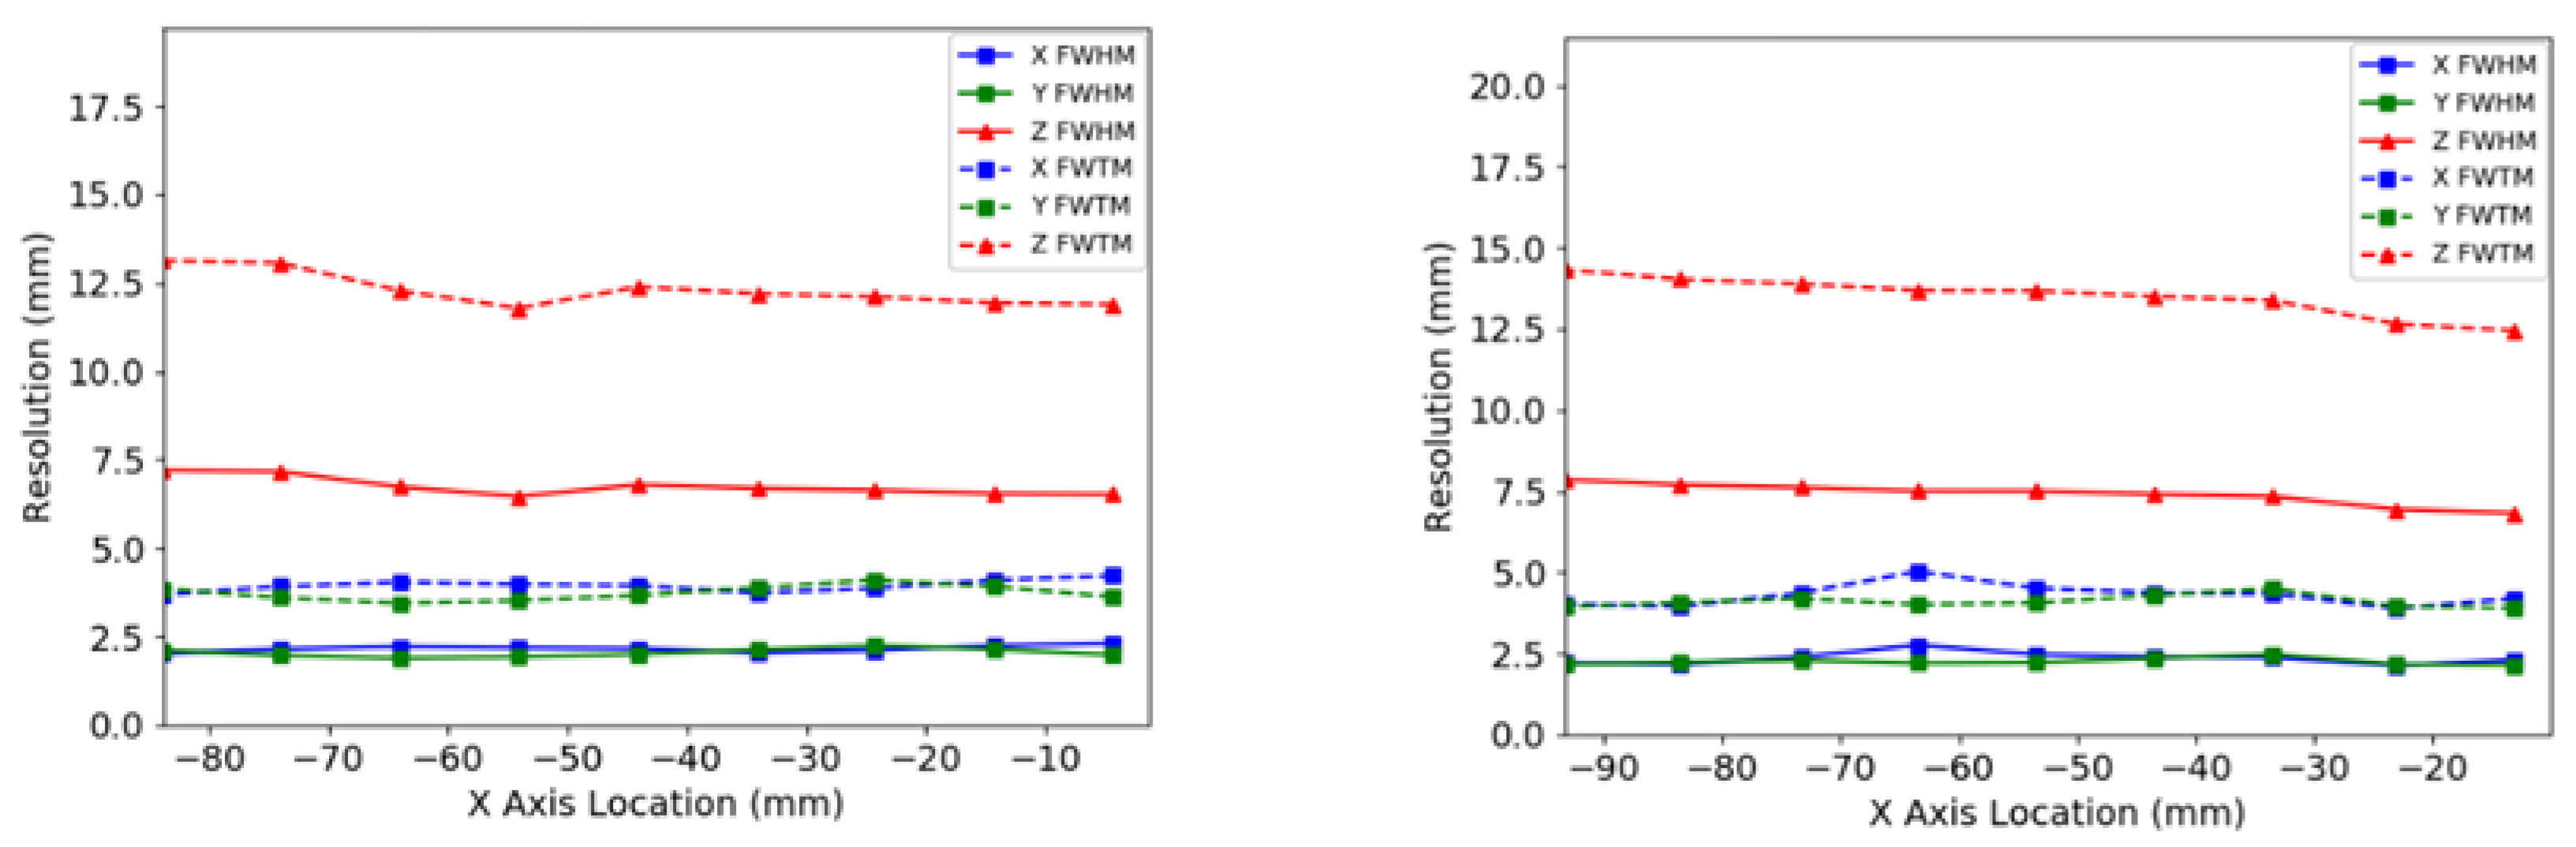
| In-plane X (mm) | 2.2 ± 0.1 | 4.1 ± 0.2 | 2.4 ± 0.2 | 4.4 ± 0.4 |
| In-plane Y (mm) | 2.2 ± 0.1 | 4.1 ± 0.2 | 2.3 ± 0.1 | 4.1 ± 0.1 |
| Cross-plane Z (mm) | 7.8 ± 0.3 | 14.2 ± 0.5 | 6.6 ± 0.9 | 12.1 ± 1.7 |
| Resolution at Z = 20 mm | FWHM | FWTM | FWHM | FWTM |
| In-plane X (mm) | 2.4 ± 0.2 | 4.3 ± 0.3 | 2.5 ± 0.1 | 4.5 ± 0.1 |
| In-plane Y (mm) | 2.2 ± 0.1 | 4.1 ± 0.2 | 2.2 ± 0.2 | 4.1 ± 0.3 |
| Cross-plane Z (mm) | 7.3 ± 0.5 | 13.3 ± 0.9 | 6.9 ± 0.6 | 12.7 ± 1.0 |
| Detector separation | 60 mm |
| Peak absolute slice sensitivity | 3.5% |
| Peak slice sensitivity | 32 cps/kbq |
| Average total absolute sensitivity | 2.4% |
| 60 mm Angle Allowance (kcps) | 90 mm Angle Allowance (kcps) | 110 mm Angle Allowance (kcps) | 144 mm Angle Allowance (kcps) | |
|---|---|---|---|---|
| Peak NECR | 9.6 | 17.3 | 17.8 | 18.1 |
| Peak true rate | 13.8 | 28.5 | 32.5 | 36.4 |
| Peak prompt rate | 19.7 | 46.9 | 59.3 | 73.1 |
| Peak scatter rate | 4.15 | 13.9 | 20.9 | 29.3 |
| Peak random rate | 1.63 | 4.35 | 5.76 | 7.31 |
| PET System | Efficiency at Peak Count Rate (cps/MBq) | Peak NECR (kcps) | Concentration at Peak NECR (kBq/mL) | Phantom Volume (mL) | Activity at Peak NECR (MBq) |
|---|---|---|---|---|---|
| Radialis PET Camera (NU-4) | 5650 | 17.8 | 10.5 | 300 | 3.15 |
| uExplorer [50] (NU-2) (Total Body) | 3790 | 1440 | 16.8 | 22,600 | 380 |
| Siemens Biograph Vision Quadra (NU-2) [51] (PET/CT) | 2666 | 1613 | 27.49 | 22,000 | 605 |
| Oncovision Mammi PEM Dual Ring (NU-4) [49] (PEM) | 1260 | 34.0 | 31.2 | 866 | 27.0 |
| GE Discovery IQ [42] (PET/CT) | 618 | 123.6 | 9.1 | 22,000 | 200 |
| GE Discovery MI (NU-2) [52] (PET/CT) | 581 | 266 | 20.8 | 22,000 | 458 |
| Phillips Vereos (NU-2) [53] (PET/CT) | 556 | 646 | 52.8 | 22,000 | 1160 |
| GE Signa PET [54] (PET/MR) | 524 | 218 | 17.8 | 22,600 | 402 |
| Siemens Biograph Vision (NU-2) [55] (PET/CT) | 435 | 306 | 32 | 22,000 | 704 |
| Naviscan PEM Flex Solo II (NU-4) [44] (PEM) | 393 | 10.6 | 90 | 300 | 27.0 |
Publisher’s Note: MDPI stays neutral with regard to jurisdictional claims in published maps and institutional affiliations. |
© 2022 by the authors. Licensee MDPI, Basel, Switzerland. This article is an open access article distributed under the terms and conditions of the Creative Commons Attribution (CC BY) license (https://creativecommons.org/licenses/by/4.0/).
Share and Cite
Stiles, J.; Baldassi, B.; Bubon, O.; Poladyan, H.; Freitas, V.; Scaranelo, A.; Mulligan, A.M.; Waterston, M.; Reznik, A. Evaluation of a High-Sensitivity Organ-Targeted PET Camera. Sensors 2022, 22, 4678. https://doi.org/10.3390/s22134678
Stiles J, Baldassi B, Bubon O, Poladyan H, Freitas V, Scaranelo A, Mulligan AM, Waterston M, Reznik A. Evaluation of a High-Sensitivity Organ-Targeted PET Camera. Sensors. 2022; 22(13):4678. https://doi.org/10.3390/s22134678
Chicago/Turabian StyleStiles, Justin, Brandon Baldassi, Oleksandr Bubon, Harutyun Poladyan, Vivianne Freitas, Anabel Scaranelo, Anna Marie Mulligan, Michael Waterston, and Alla Reznik. 2022. "Evaluation of a High-Sensitivity Organ-Targeted PET Camera" Sensors 22, no. 13: 4678. https://doi.org/10.3390/s22134678