Article

Eco-Labeled Seafood: Determinants for (Blue) Green Consumption

1
Department of Ecology, Environment and Plant Sciences, Stockholm University, SE-106 91 Stockholm, Sweden
2
Department of Earth Sciences, Uppsala University, Villav. 2, SE-752 36 Uppsala, Sweden
3
Stockholm Resilience Centre, Stockholm University, SE-106 91 Stockholm, Sweden
4
Royal Swedish Academy of Sciences, Box 50005, SE-104 05 Stockholm, Sweden
5
Beijer Institute, Royal Swedish Academy of Sciences, Box 50005, SE-104 05 Stockholm, Sweden
1
Norges Sjömatsråd, Stockholm, Sweden
*
Author to whom correspondence should be addressed.
Sustainability 2016, 8(9), 884; https://doi.org/10.3390/su8090884
Submission received: 23 July 2016 / Revised: 25 August 2016 / Accepted: 30 August 2016 / Published: 2 September 2016

Abstract

:
Eco-certification has become an increasingly popular market-based tool in the endeavor to reduce negative environmental impacts from fisheries and aquaculture. In this study, we aimed at investigating which psychological consumer characteristics influence demand for eco-labeled seafood by correlating consumers’ stated purchasing of eco-labeled seafood to nine variables: environmental knowledge regarding seafood production, familiarity with eco-labels, subjective knowledge, pro-environmental self-identification, sense of personal responsibility, concern for negative environmental impacts from seafood production, perceived consumer effectiveness, gender and education. Questionnaires were distributed to consumers in Stockholm, Sweden, and the data were tested with multiple regression analysis using linear modeling and model averaging (n = 371). Two variables were the best predictors of stated purchasing of eco-labeled seafood: (i) recognition and understanding of eco-labels for seafood (Marine Stewardship Council, Fish for Life, Aquaculture Stewardship Council and KRAV); and (ii) concern for negative environmental impacts associated with seafood production. Meanwhile, consumer environmental knowledge was a weaker predictor. Results from this study suggest that strengthening the emotional component of consumer decision-making and improving the level of consumer familiarity with seafood eco-labels could stimulate more pro-environmental seafood consumption.

1. Introduction

Capture fisheries and aquaculture (farming of aquatic organisms, including animals and plants) can, just as other food production sectors, negatively impact aquatic and terrestrial ecosystems, e.g., through overfishing (fisheries for human consumption and for aquatic oils and proteins used in animal feeds), eutrophication due to the release of excess nutrients, feed production and the spread of invasive species and diseases [1,2,3]. Such adverse environmental and social impacts have together with a perceived failure of regulatory mechanisms (e.g., implementation of national legislation and codes of conduct to improve the sector) largely driven the development of seafood eco-certification programs. During the last decade, the number of eco-labeled seafood products available on European and North American markets has increased substantially [4]. While there has been a rapid development of certification initiatives for seafood, the eco-certified share of global seafood production remains small [4,5]. A further increase is conceivably dependent on consumers’ demand for labeled products, and consumers are therefore key actors in market-based efforts aiming at improving the performance of the seafood sector.
As the number of certification schemes for seafood is growing, so is the body of literature analyzing consumers’ perceptions of, and willingness to pay for, eco-labeled seafood. The majority of studies have focused on capture fisheries and only a few on farmed seafood [6]. Earlier work has either: (a) applied an experimental approach using contingent valuation to estimate consumers’ willingness to pay for eco-labeled seafood [7,8,9,10]; (b) examined consumers’ attitudes towards eco-labeling of seafood [11,12,13]; (c) more generally explored the perceived importance of sustainability and ethics related to seafood [14,15]; or (d) used market data to investigate whether there is a price premium for eco-certified seafood [16,17]. While this work has substantially increased our understanding of what factors predict willingness to purchase sustainable seafood, to our knowledge, no study has yet investigated how consumers’ self-reported purchasing behavior of eco-labeled seafood is correlated with environmental knowledge and other internal factors expected to predict pro-environmental consumption. This study addresses this gap or knowledge deficit using consumer data from Stockholm, Sweden. First, we investigated the level of consumer knowledge regarding environmental impacts of seafood production and production practices (both aquaculture and capture fisheries) and the main sources of information used by consumers. Second, we assessed the relative importance of key personal characteristics predicted to be essential for pro-environmental consumer behavior to identify the most crucial internal barriers for increased demand for eco-labeled seafood. Sweden is a particularly interesting case since the market for eco-labeled food can be considered relatively mature [18,19] (the sales value of organic food reached more than seven percent by 2015 [20]), and Swedish consumers generally show positive attitudes towards eco-labeled food products [21].

2. Methods

The Methods section begins with a brief introduction to the pro-environmental behavior literature (Section 2.1) followed by a presentation of the theoretical framework used for this study (Section 2.2) and the methodological approach for gathering and interpreting data (Section 2.3, Section 2.4 and Section 2.5).

2.1. Theoretical Background

A number of theoretical frameworks have been developed to identify internal (e.g., awareness and attitudes) and external (e.g., price and availability) drivers that positively correlate with pro-environmental behavior, such as consumption of eco-labeled food. External predictors relevant for determining the extent of pro-environmental consumer behavior include affordability and the availability of sustainable/eco-labeled goods [22]. Internal factors are more multi-faceted. Empirical work has shown that consumer awareness can be a relevant determinant for predicting purchasing decisions and that there appears to be a link between environmental knowledge and tendency to purchase eco-labeled food [23,24,25,26]. Earlier research has also indicated potentially stronger links between consumers’ subjective knowledge (thus, their perceived level of knowledge) and pro-environmental consumer behavior than between (actual) knowledge and behavior [23,27]. Related to this are other internal factors, such as consumers’ pro-environmental self-identification [28], concern for negative environmental impacts [29,30] and perceived consumer effectiveness (PCE). The latter is defined as the extent to which the individual believes (s)he can contribute to better production practices by choosing an eco-labeled alternative [23,31,32,33]. While previous work has shown that certain socio-demographic characteristics seem to be correlated with pro-environmental behavior [34], e.g., that women and well-educated people are more prone to green consumption [35], results between studies are inconsistent, suggesting that demographic variables may be a comparatively poor predictor of pro-environmental conduct [36].

2.2. Theoretical Framework Guiding the Study

The theoretical framework guiding this study draws on existing theory regarding internal factors affecting pro-environmental consumer behavior. Specifically, we modify the model proposed by Kollmuss and Agyeman (2002) [37] to investigate the role of consumers’ knowledge pertaining to seafood production and other internal factors (Figure 1). In the original model, three broad categories of internal variables, namely knowledge, feelings/fear/emotional involvement and values/attitudes, as well as external factors are predicted to influence pro-environmental behavior. In our modified framework, the focus was solely on the cognitive (knowledge of issues and action strategies) and emotional elements. Subjective knowledge, pro-environmental self-identification, personal responsibility and PCE were factors added to the original model. The model therefore predicts that pro-environmental behavior is determined by external and internal factors, the latter including PCE, environmental knowledge and awareness of action strategies, environmental concern (i.e., emotional involvement), pro-environmental self-identification, as well as values, attitudes and beliefs.
The measure for pro-environmental behavior used in this study is ‘stated purchasing of eco-labeled seafood’, thus the extent individuals report that they buy labeled alternatives. Self-reported behavior has traditionally been used as a measure for ‘habit’ and directly influences future conduct [38], and we therefore assume it to be closely related to pro-environmental behavior. In other words, people stating that they purchase seafood to a given extent intend to do so also in the future. Earlier work has pointed out that individuals participating in research measuring stated behavior or preferences sometimes tend to overestimate the extent they behave pro-environmentally, e.g., are willing to pay for an eco-labeled product [39]. However, others suggest that the size of this intention-behavior gap (if it exists) depends in large part on, e.g., how questions are posed [40] and the level of consumer objective knowledge [41]. In short, even though there may be a (slight) gap between intention and actual conduct, empirical work shows that a link between stated and actual behavior exist, while not always as strong as stated by respondents (e.g., [42]). The independent factors investigated here (marked with an asterisk in Figure 1) are presented in Table 1, which elaborates on the postulated relation to stated purchasing of eco-labeled seafood (SPES) and introduces the variables measured in the survey instrument used in this study: knowledge of environmental impacts from seafood production system, awareness of seafood eco-labels, worry about environmental impacts linked to seafood production systems, PCE, gender and level of education.

2.3. Data Collection

Data were collected through a consumer questionnaire distributed in shopping malls in the Stockholm region (reachable by the public transport system) in October–December 2013. The locations were chosen to include a broad socio-economic segment of the population, and surveying was conducted between 10.00 a.m. and 7.00 p.m. on weekdays and weekends. The sampling strategy was to randomly approach respondents and ask if they were willing to participate in a research study on seafood consumption. The survey was self-administered by the respondents (questionnaire filled in individually at the time of surveying), and in total, 406 out of 500 distributed surveys were completed. The non-probability sampling strategy together with the method used to distribute surveys does not guarantee a statistically-representative sample of the Swedish population as a whole. Moreover, there is a risk that people interested in the topic of seafood consumption and eco-labeling participated to a higher extent than others. However, the demographic characteristics of the sample (n = 406) presented in Table 2 shows that a broad segment of the population was represented. There was a slight bias towards younger age segments (aged 18–54 years), women and people with children in the household. Respondents with a university degree were also overrepresented in the sample. The majority (83%) was living in large urban areas (>250,000 inhabitants) in Sweden, presumably in or around Stockholm.

2.4. Operationalizing Explanatory Variables

The survey instrument and information on how the questions were coded for the statistical analysis are presented in Appendix A and in Table A1. Shorter versions of the variables included in the statistical analysis are henceforth presented italicized in parenthesis (see also Table 1, Column 2). The purchasing behavior was captured by asking to what extent respondents buy eco-labeled seafood when available (five-point Likert scale). The objective environmental knowledge (obj. knowledge) related to fisheries and aquaculture was assessed through eight questions, half of them focusing on aquaculture and half on capture fisheries. Three potential answers were provided for each question, of which one was correct. Even though multiple-choice questions imply an inherent risk of participants obtaining the correct answer by speculating or by exclusion of unlikely answers, we argue that by including two false answers and only one correct, this risk can be considered small. A ‘don’t know’ alternative was not included, since the objective was to force respondents to choose based on their current knowledge (see also, e.g., [48]). The final measure used in the analysis was the total number of correct answers (0–8). Awareness of action strategies (labels) was assessed by presenting eco-labels and asking respondents to state whether they recognized the logos or not and if they were aware of the meaning of the scheme (yes/no). The included schemes were selected to represent the Swedish market: Marine Stewardship Council (MSC), Aquaculture Stewardship Council (ASC), Fish for Life (Findus, industry led scheme) and KRAV (Swedish organic certification scheme). A fake eco-label (EcoFish) was also included in order to investigate the extent to which people tended to falsely state that they recognize a label.
For the remainder of questions, a five-point Likert scale was used to capture the extent of agreement/disagreement or perception. The perceived consumer effectiveness (PCE) was assessed by asking to what extent the respondents believed that they as individuals contribute to more sustainable production methods by purchasing eco-labeled seafood. To investigate consumers’ subjective knowledge (subj. knowledge), we asked how the respondents perceive their knowledge level pertaining to seafood production. Concern (concern) was investigated by asking to what extent the respondents feel worried about negative environmental impacts from fisheries and aquaculture. Pro-environmental identity (identity) was measured through two separate questions, the first aiming to capture the self-perceived environmental consciousness and the second stated membership in an environmental organization (‘yes’ or ‘no’). In order to assess the level of responsibility for seafood sustainability that respondents perceived should be attributed to different actors, the participants were asked to grade the level of responsibility for a number of societal groups and institutions. The measure for the variable responsibility (responsibility) was the extent respondents perceived that consumers’ should be responsible for an environmentally-sustainable production of seafood. While it has been suggested that multi-item scales are preferred before single-item measures in survey instruments [49], single-item measures have also been demonstrated to accurately capture a certain factors [50], e.g., PCE [51]. The application of primarily single-item constructs in this study enabled us to assess a large range of factors using a survey instrument with a reasonable length.
Respondents’ primary sources of information were investigated by asking where they learn about environmental impacts from capture fisheries/aquaculture. A number of key sources (retailers, authorities, environmental organizations, producers/fishermen, media and friends/colleagues) were listed for the respondents to rate. Additionally, information on seafood consumption level, as well as demographic variables (e.g., age, gender and education) was collected.

2.5. Statistical Analysis

General linear modeling and multi-model inference (MMI), an information theoretic approach [52,53], were used to examine the contribution of selected factors to stated purchasing behavior of eco-labeled seafood among consumers in the Stockholm region. MMI provides a set of potential models that all predict the dependent variable to a certain degree while also uncovering the relative importance of the explanatory variables included. A key benefit with this approach is that goodness of fit is rewarded, while inclusion of a high number of independent variables is penalized. Furthermore, MMI provides a more transparent selection of possible models than conventional multiple regression analysis, which traditionally only reports on the one most significant model [54].
Given the semi-explorative characteristics of this work, we included all nine of the explanatory variables outlined in the framework. Prior to conducting the multiple linear regression and MMI, multicollinearity between variables was tested for by investigating variance inflation factors (VIF < 2) and the appropriateness of the full model containing all variables assessed by plotting residuals with fitted values and with a normal Q-Q plot. The strength of evidence for each model generated is indicated by Akaike’s information criterion (AIC) and AICc, the latter measure including penalization for a higher number of model parameters. We use AICc in our interpretation because our sample (n = 371) to variable (K = 9) ratio is close to 40 (371/9 = 41.2) (see [54] for more details). Models were compared by using ΔAICc values, evidence ratios and Akaike weights (w), where ΔAICc = AICi (the AIC for model i)—‘min AIC’ (the AIC value for the best model). A model with a ΔAICc > 2 can be considered comparatively poor at explaining the dependent variable (corresponds with an evidence ratio of 2.7; Burnham et al., 2011); thus, we only present models with ΔAICc < 2 in detail in the Results section. ΔAIC can be translated to evidence ratios, which indicate the relative likelihood of model i versus model j [52]. Akaike weights (wi) indicate the likelihood that a particular model is the top one for the sampling situation considered. A higher weight indicates a better fit. In combination, these three measures assist in the interpretation of the relative importance of each model. MMI analysis was done using the dredge function in the R MuMin package (R Development Core Team 2011).

3. Results

The first three parts of the Results Section 3.1, Section 3.2 and Section 3.3 provide descriptive statistics of the stated purchasing of eco-labeled seafood, respondents subjective and objective knowledge along with PCE, self-identification and level of concern. Except for ‘source of environmental information’ (n = 396), 406 respondents were represented in the descriptive statistics. In Section 3.4, the results from the statistical analysis (MMI) are presented (n = 371). The smaller sample size is due to several ‘don’t know’ responses in the large sample (n = 406), not possible to include in the statistical analysis.

3.1. Respondents and Seafood Purchasing

The majority of the respondents purchased seafood in grocery stores at least once per week (41%) or per month (49%). A minority (16%) stated that they always buy eco-labeled seafood when available, whereas 68% reported to sometimes purchase eco-labeled seafood (3–4 on a five-point scale). The average rate (1–5) of stated purchasing of eco-labeled seafood was 3.43 (±1.00) (SD).

3.2. Objective and Subjective Knowledge

Most participants (78%) perceived themselves to have a low or moderate level of knowledge (1–3 on a five-point scale) pertaining to production of seafood (average 2.5 ± 1.23). The objective knowledge question with the highest rate of correct answers related to northern prawns, followed by a question about farming of tropical shrimp (Table 3). None of the eight questions had a correct response rate above 74%, indicating a fairly low level of factual knowledge related to seafood production.
The level of recognition and perceived understanding of labels was for the majority of eco-labels low to moderate (Table 4). The one exception was the Swedish KRAV label, which 94% of the respondents recognized. The most common eco-label for seafood on the Swedish market at the time of writing was the MSC label, solely recognized by 44% of the respondents and understood by 13%. Interestingly, 17% (more than one out of six) of the respondents stated that they recognized the fake label, implying that the actual level of recognition and understanding of the labels might be lower than as indicated by the results.
The main source of information (4–5 on a five-point scale) was media (55%), followed by environmental NGOs (40%) and friends/colleagues (36%). The information sources least accessed were retailers (7%) and fishermen/farmers (10%).

3.3. Environmental Concern and Pro-Environmental Self-Identification

More than half of the respondents (57%) stated that they feel worried about negative environmental impacts related to seafood production (4–5 on a five-point scale), and 44% perceived themselves to be environmentally conscious (4–5 on a five-point scale). The majority (63%) stated a high level (4–5 on a five-point scale) of PCE. Authorities (through provision of information), the government and seafood companies were identified to have the highest responsibility for sustainable seafood production, whereas consumers were stated as having the least responsibility (only 23% of the respondents rated the consumer responsibility as very high, i.e., five on a five-point scale).

3.4. Statistical Results

A total of 371 surveys were completed with respect to all nine variables included in the full model. Prior to conducting the multiple linear regression and MMI, multicollinearity between variables was tested for (VIF < 2). The full model containing all nine independent variables explained 25.4% of the variation in stated purchasing behavior of eco-certified seafood (adjusted R2). Multi-model inference yielded 512 candidate models. A total of eleven models exhibited ΔAICc < 2 and accounted for 43% of the total AIC weights (Table 5). The best model contained the variables labels, concern, identity, PCE, obj. knowledge and responsibility and had an AIC weight of 6%. Models including one of the factors
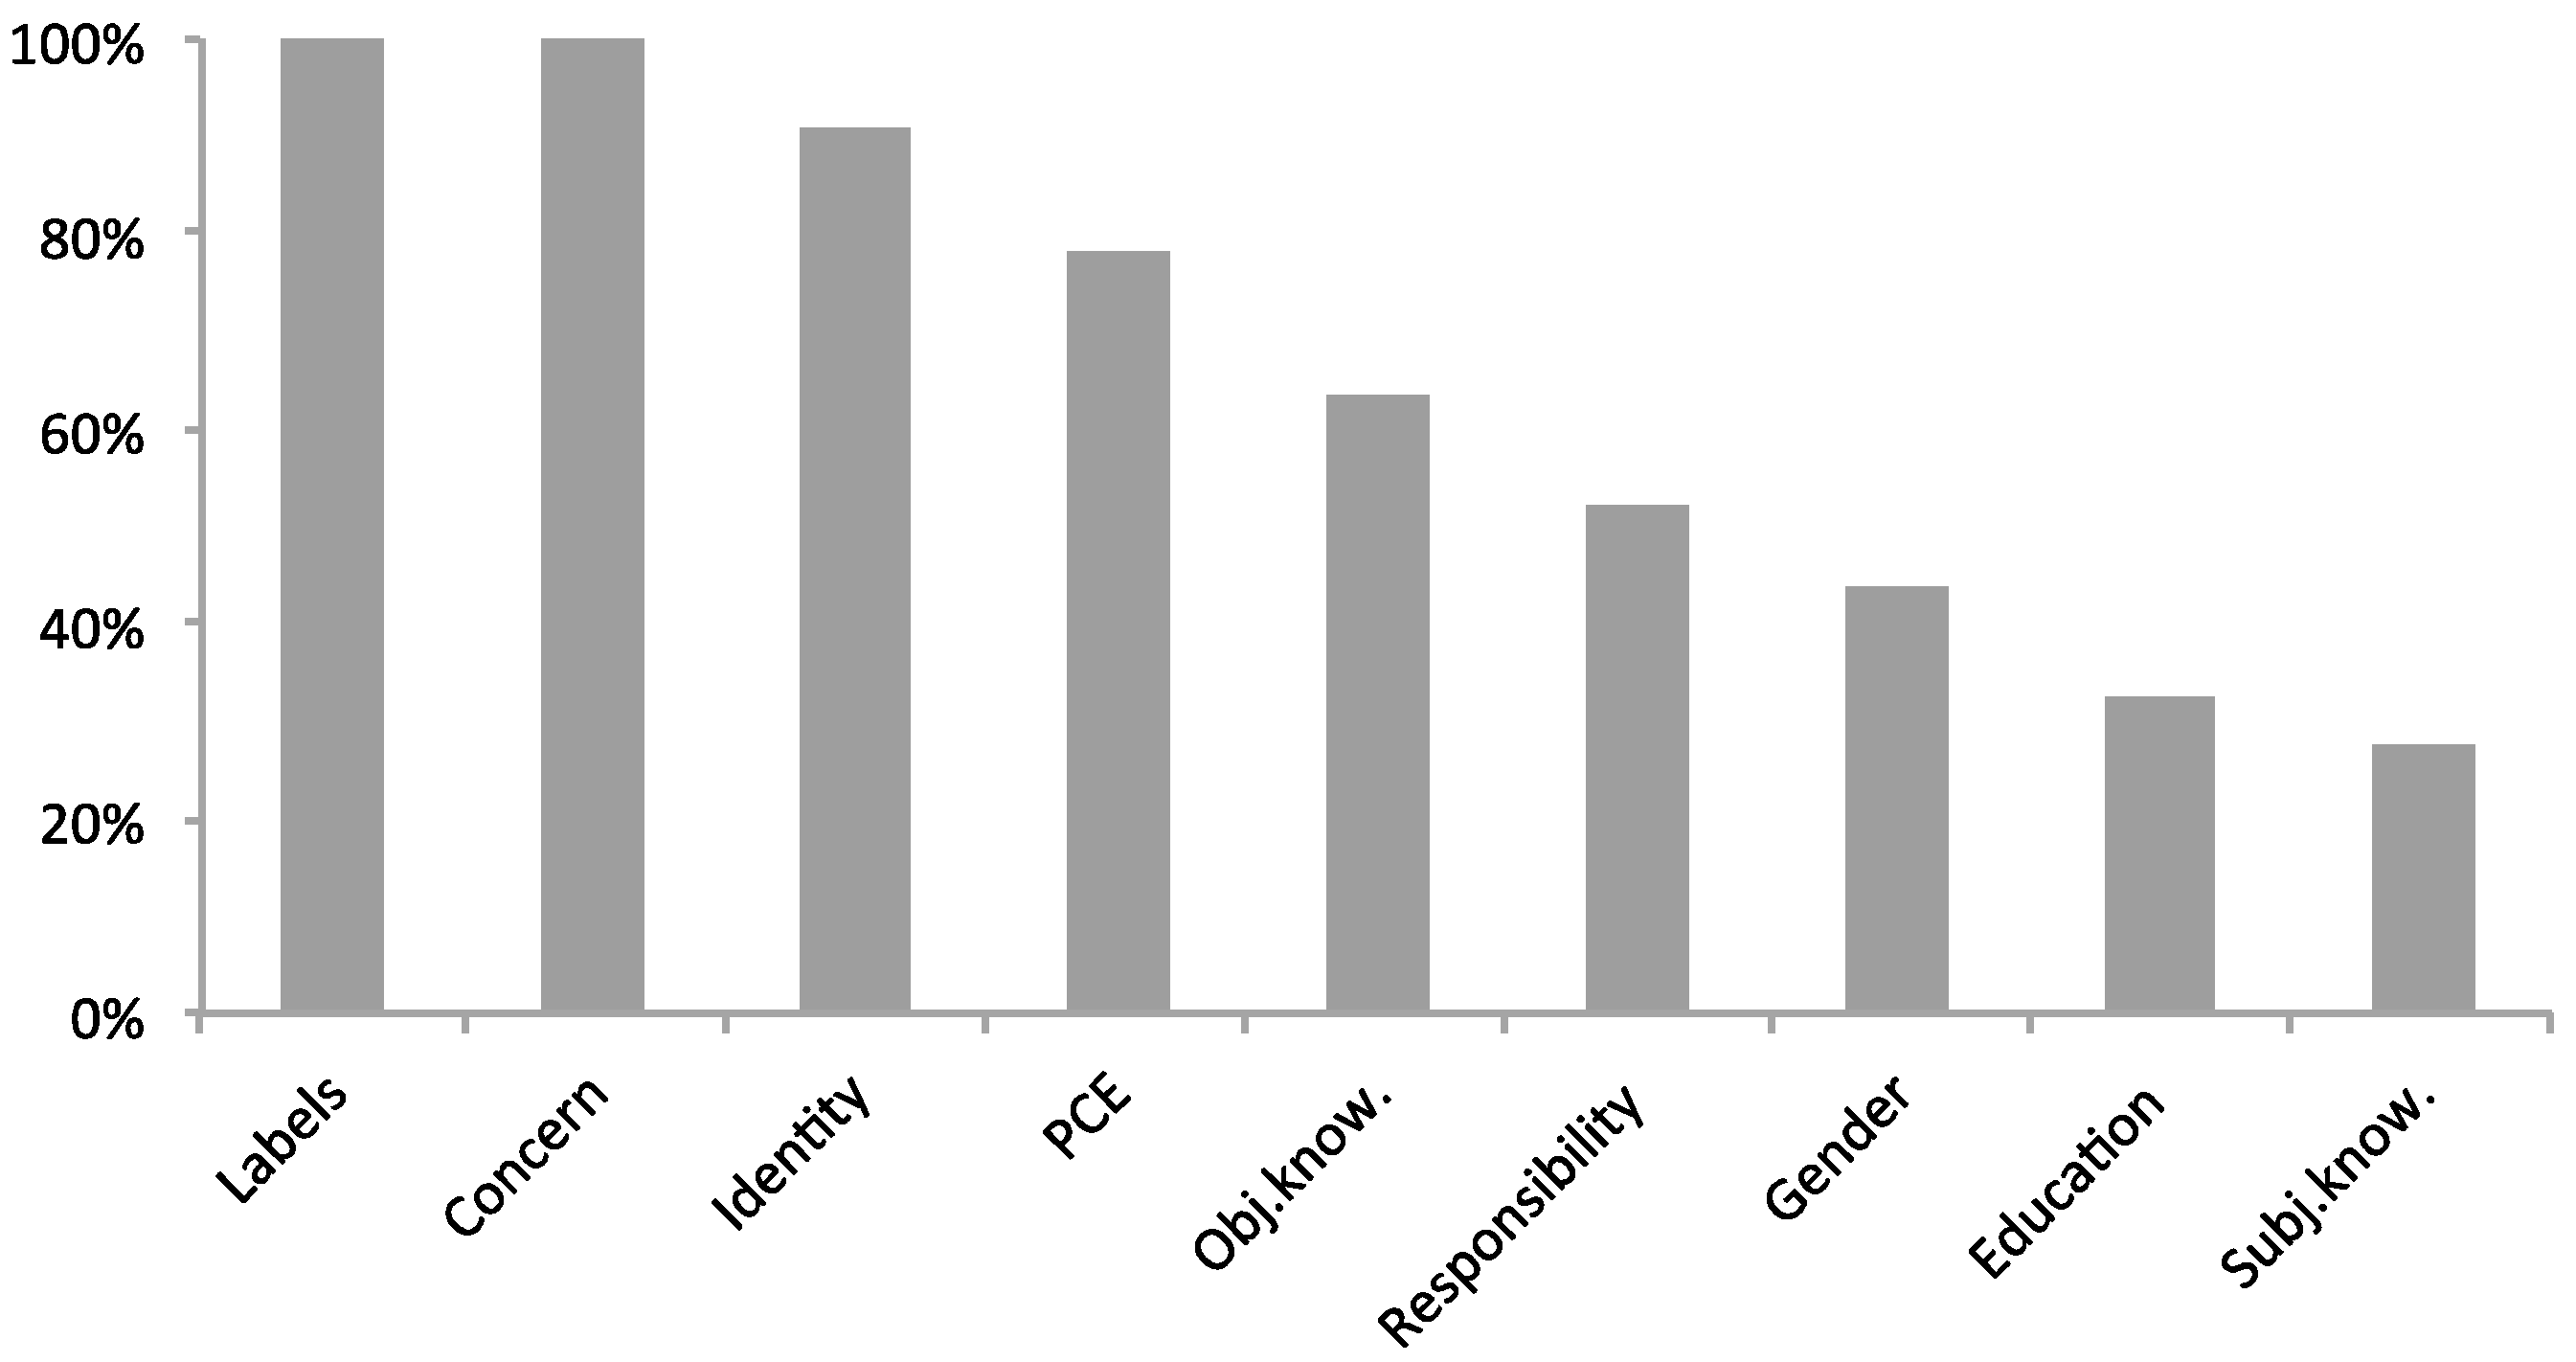
 labels or concern accounted for 100% of the cumulative weight of all of the 512 possible models, indicating a substantial importance of these two variables. Identity and PCE (accounting for 91% and 78% of cumulative weight, respectively) were also included in the majority of the high weight models and can thus also be considered relevant (Figure C1, Appendix C).
The evidence ratio for a particular model demonstrates the strength of evidence compared with the best model. The results from this study showed that the evidence for Model 1 is 2.6-times stronger than for Model 11 (Table 5). To illustrate the interpretation procedure, we removed the top three most important variables (labels, concern and identity) from the best model. The evidence ratios of the new models increased by a factor between six and 27,116, indicating the relative importance of each of the explanatory factors removed (Table 6). Another interpretation exercise was to include only the top two variables (concern and labels) in a model. This gave a ΔAICc of 11.6, corresponding to an evidence ratio of 329, implying that the model is 329-times less likely than the best model. When identity was added to this model (containing concern and labels), the evidence ratio increased to six (Table 6), substantially improving the model fit and providing substantial support for the conclusion that labels, concern and identity were the three most important variables in explaining stated purchasing behavior of eco-labeled seafood among consumers in Stockholm.
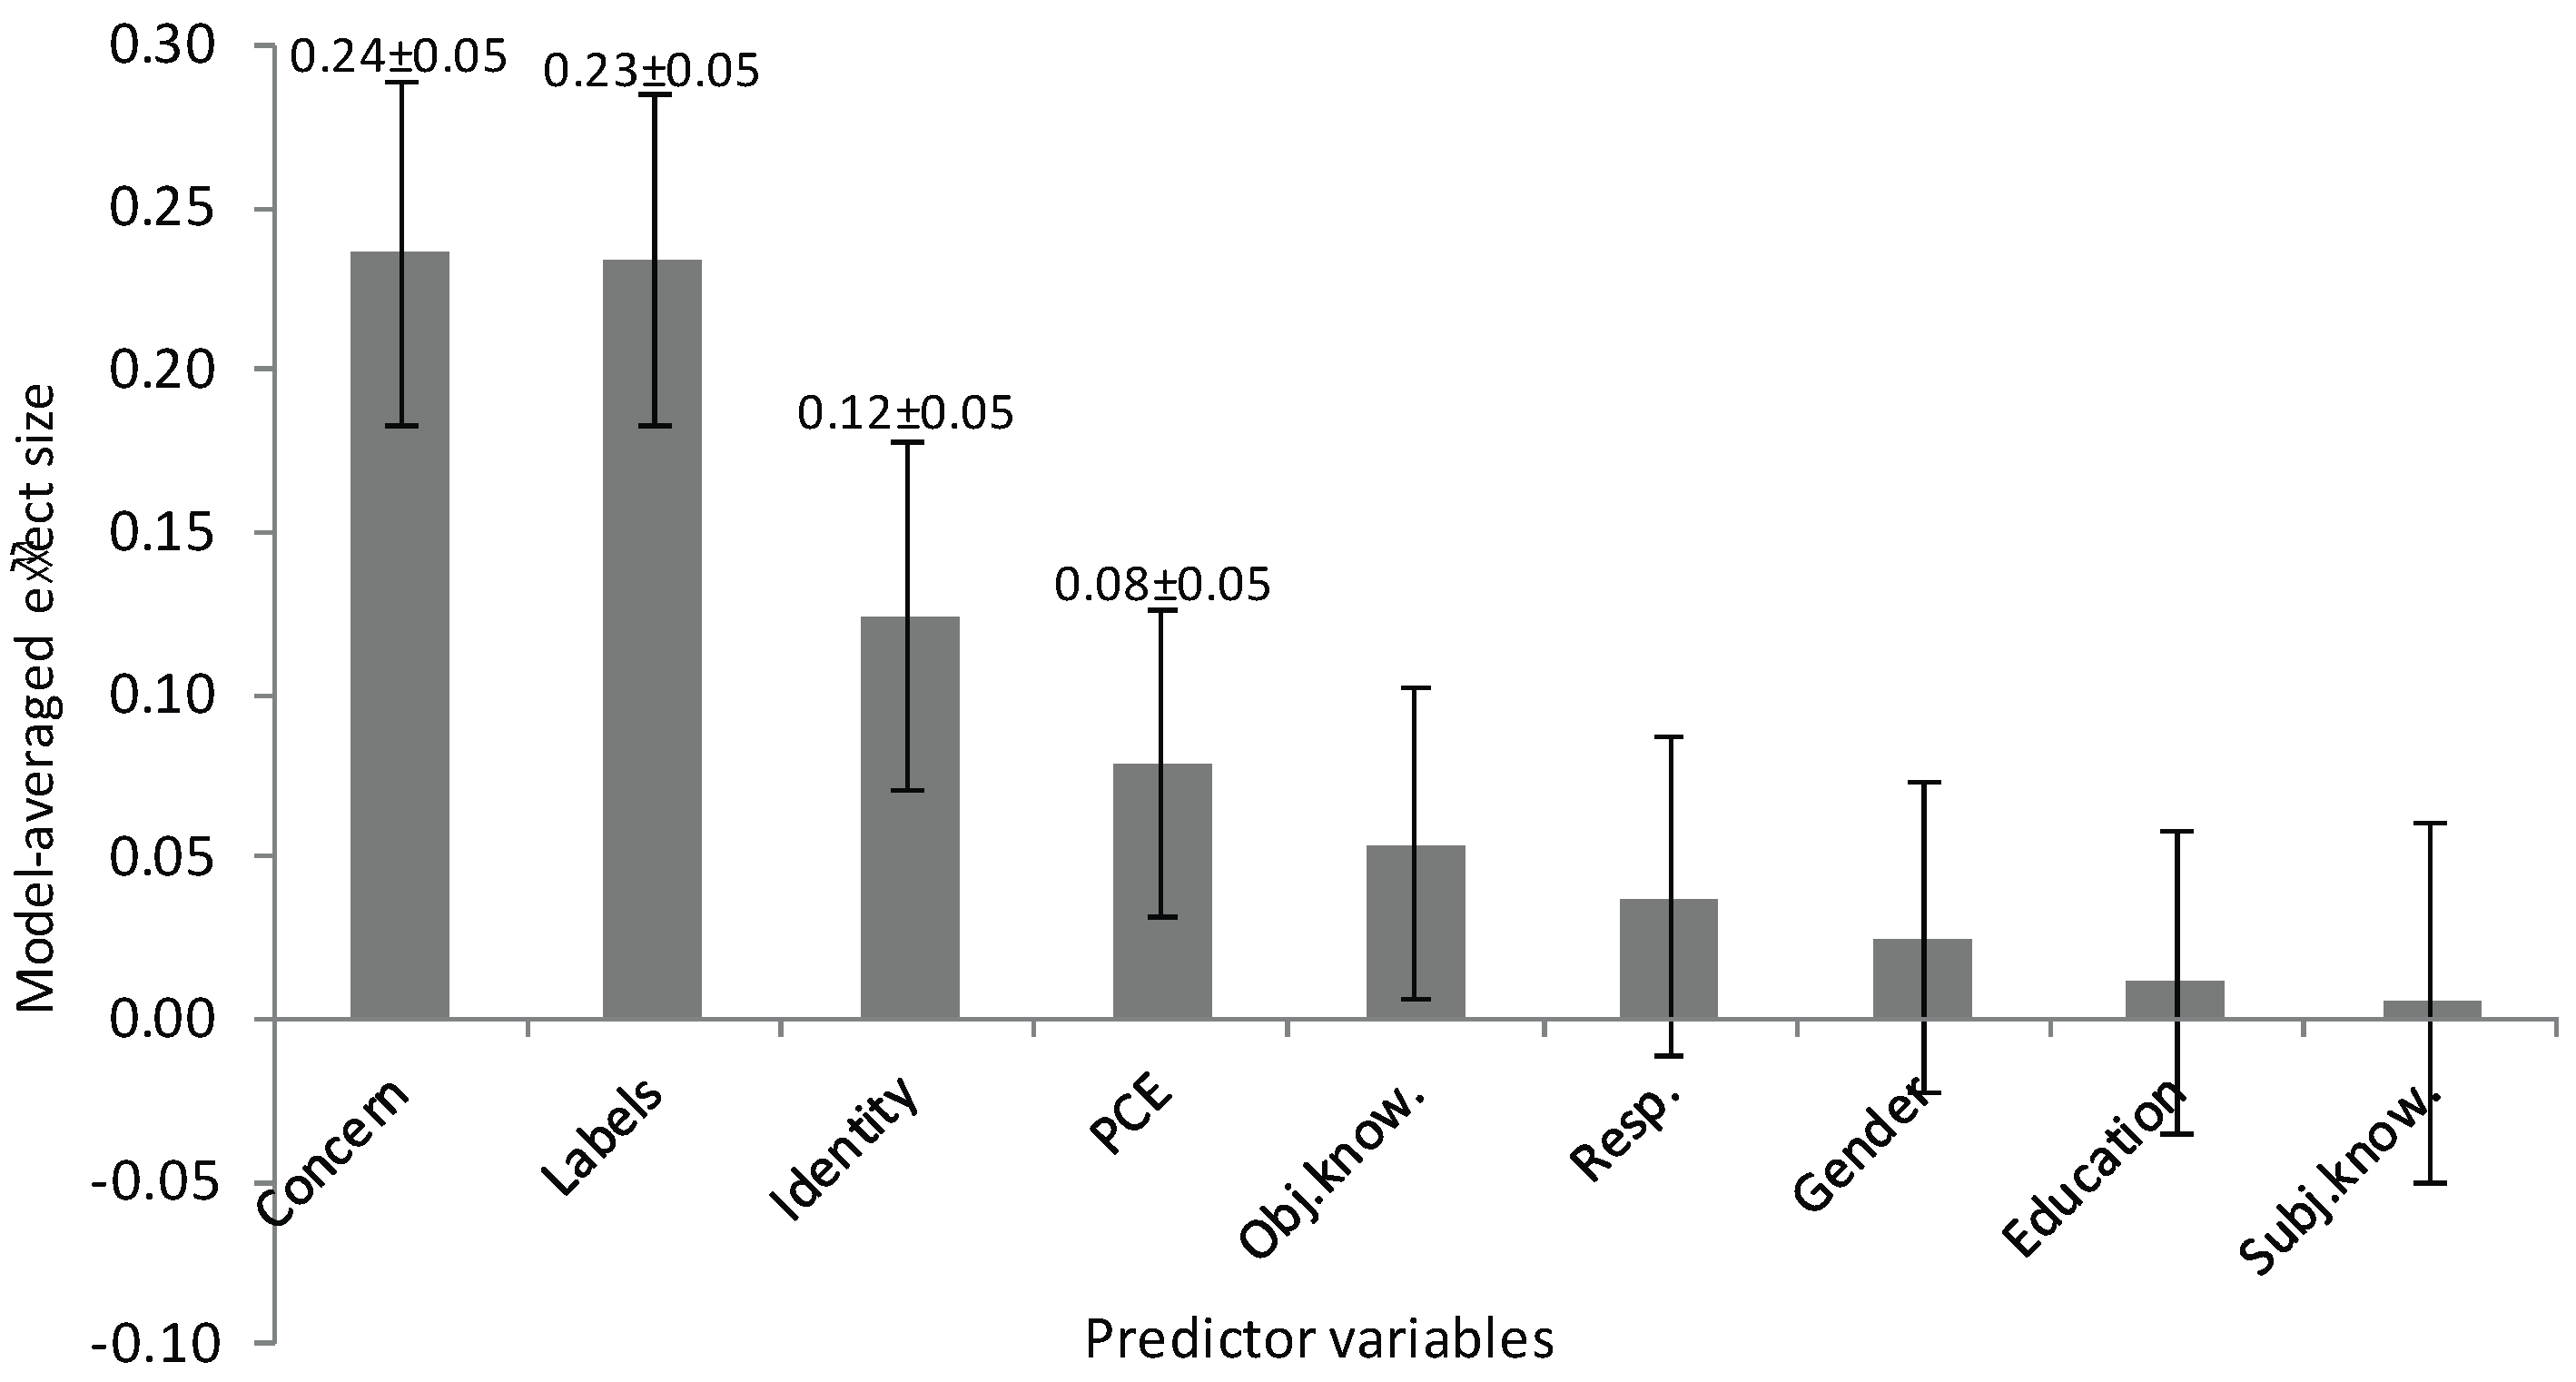
We further multiplied the standardized β-coefficients for the variables included with the weight of each individual model to get model averaging. This measure provided information on the predictive power of each explanatory variable included in the original model. The result (including shrinkage) is presented in Figure 2. For more information on the multimodel averaging step and shrinkage, see Appendix B. Concern and labels were the two variables with highest explanatory power (β = 0.24 and 0.23, respectively), followed by identity and PCE (β = 0.12 and 0.08, respectively).
A linear multiple regression analysis including the variables in the best model (labels + concern + identity + PCE + obj. know. + responsibility) was conducted as part of the MMI step in order to obtain information on which variables are statistically significant. Labels and concern (p < 0.01), as well as identity and PCE (p < 0.05) were the statistically-significant variables in the model (and also the variables with the highest model averaged effect sizes; Figure 2). The adjusted R2 value for the full model was 0.26.

4. Discussion

The first aim of this study was to assess the level of consumer environmental knowledge pertaining to aquatic food production systems and to investigate which sources of information that are most frequently used. The limited level of knowledge about seafood production systems and environmental impacts from capture fisheries and aquaculture found in this study agrees with results from earlier work, e.g., [12,63,64]. The extent of label recognition differed substantially between logos presented, ranging from 95% for the organic label KRAV to only 23% for ASC. Noteworthy is the rather low level of recognition of the MSC label (43%), the largest seafood eco-label in Sweden. However, the results are consistent with earlier investigations of familiarity with the MSC label in Sweden (45%) [65] and higher than the average of consumers from 15 countries (33%) [66]. Since label recognition was one of the most important variables in predicting stated purchasing of eco-labeled seafood, we suggest that efforts need to be directed towards increasing consumers’ familiarity and understanding of seafood eco-labels. Retailers could potentially play a key role when it comes to the provision of information for two reasons: first, because they offer an arena where consumers are likely to be susceptible to information while making purchasing decisions [67]; and second, retailers were, together with seafood producers, stated as the least important provider of environmental information pertaining to seafood production (average 1.9 ± 1.0 on a five-point scale), indicating room for improvement. However, it should be noted that the reason for the low use of retailers as a source of information is unknown and that lack of trust for commercial actors might be a barrier for consumer awareness making. Media and environmental NGOs (stated to be the most frequently-used sources of information, also supported by [68]) are other potentially important actors in increasing consumers’ familiarity with seafood eco-labels.
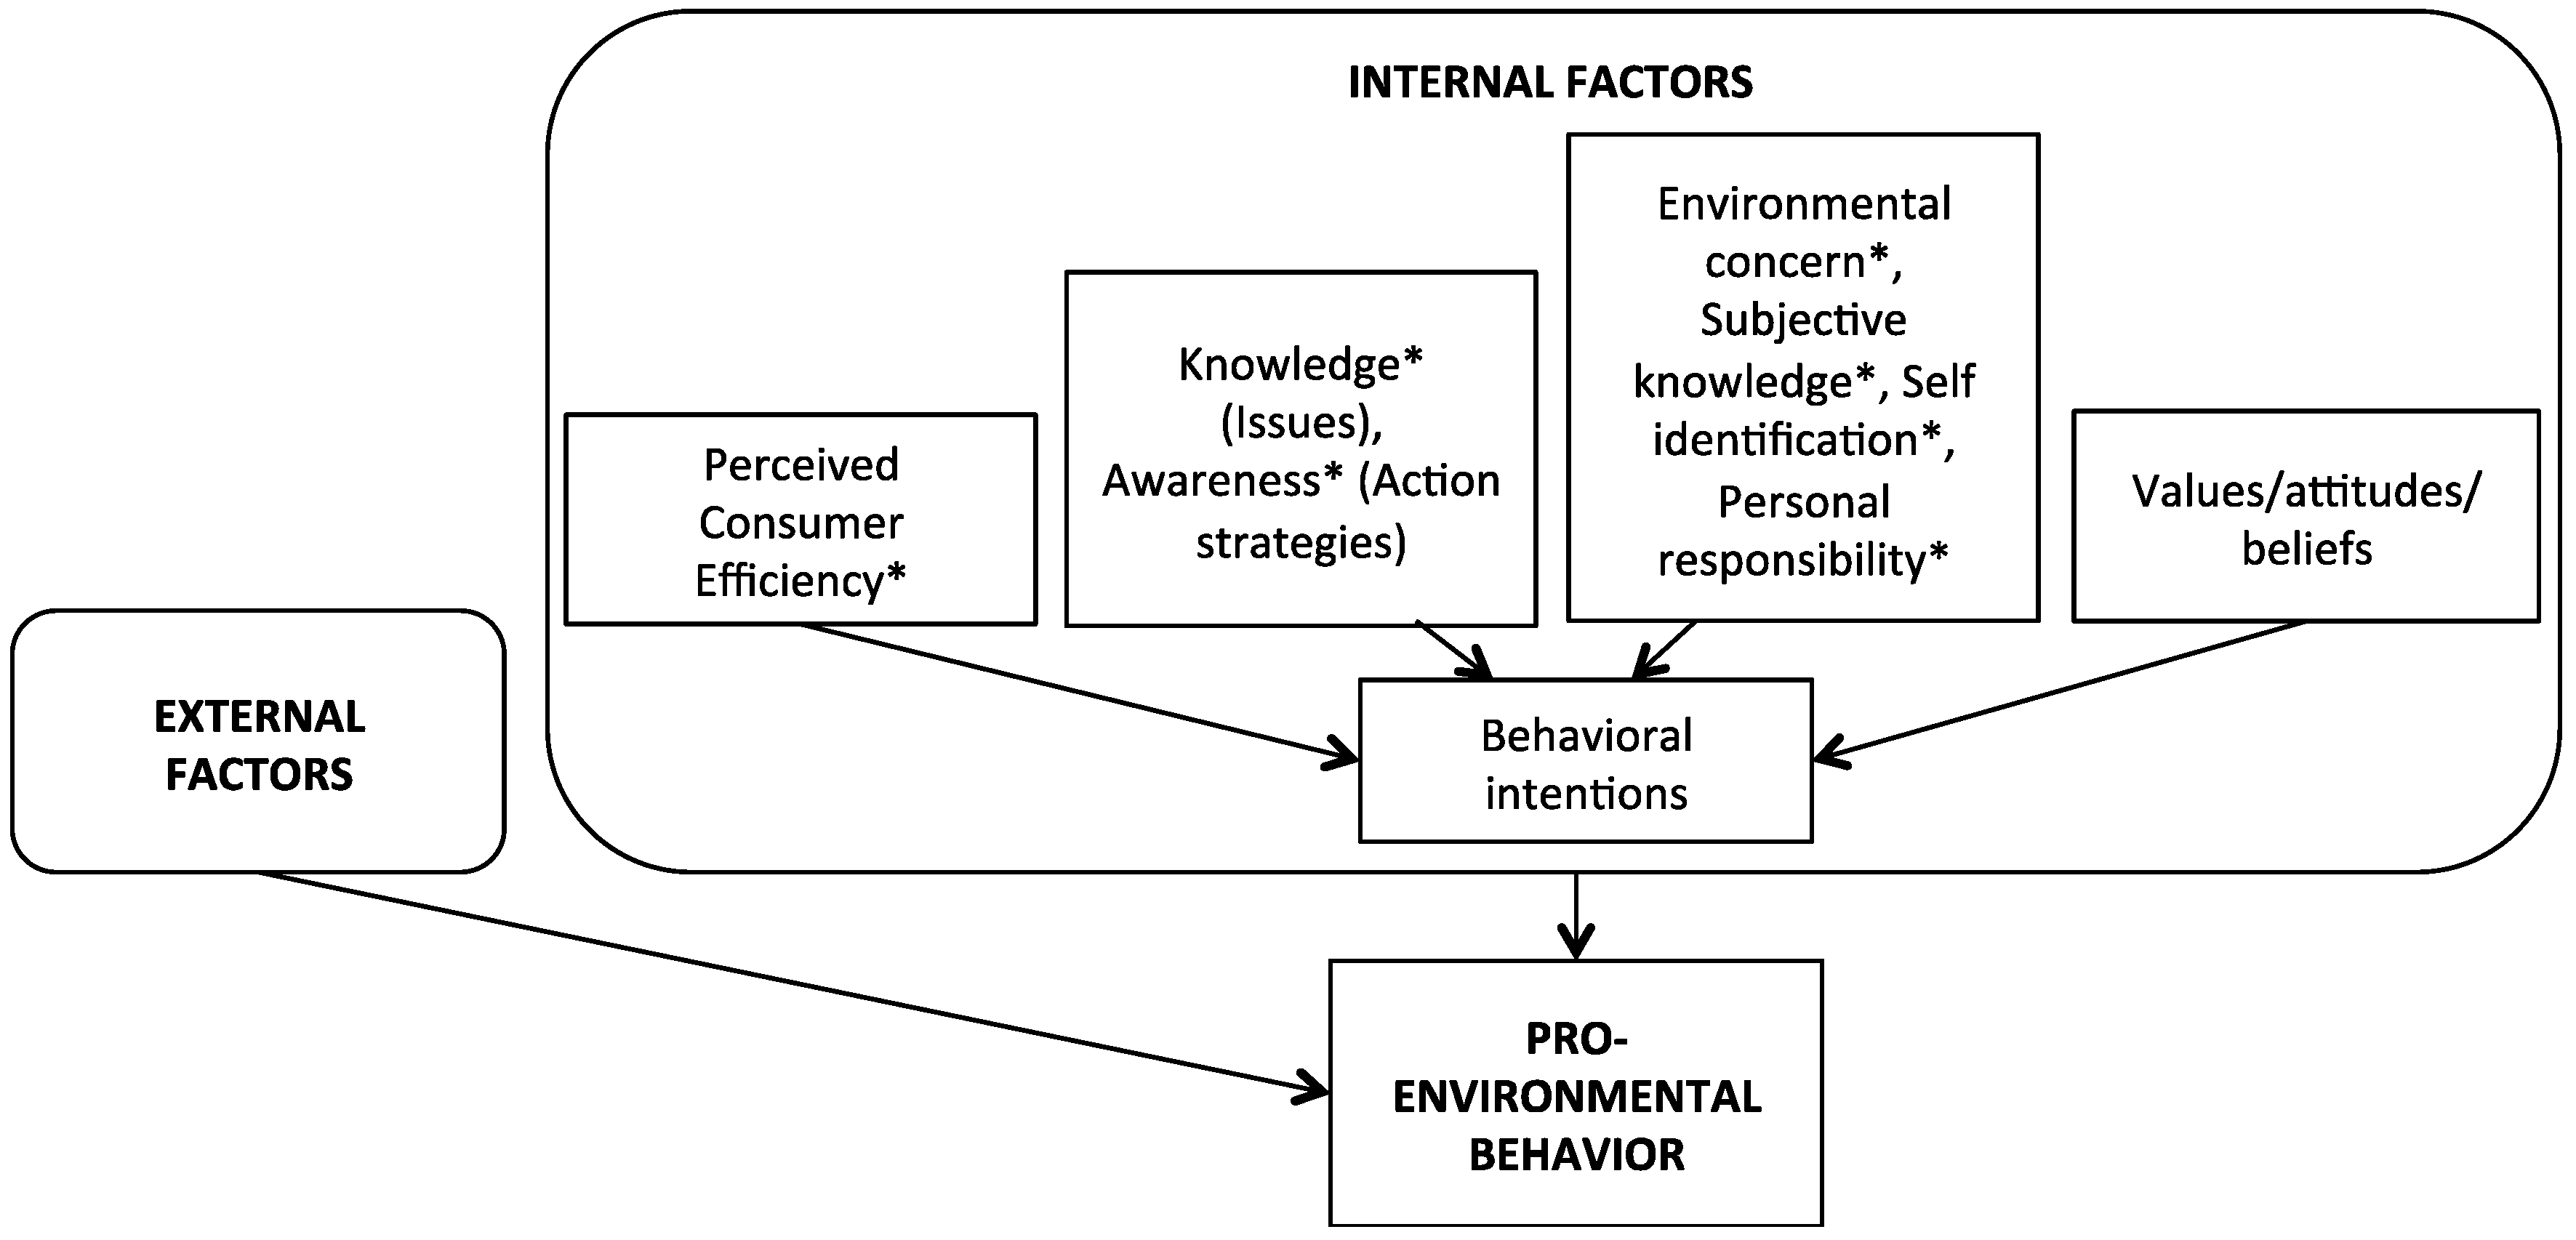
The second objective of this study was to investigate the relative importance of internal factors (i.e., consumer characteristics) predicted to affect purchasing of eco-labeled seafood. The findings support the hypothesis that cognitive (labels), as well as emotional (concern) elements predict consumers’ stated purchasing behavior of eco-labeled seafood products. While the negative framing of the question on the degree of consumer concern may lead to a slight bias towards an expressed worry among respondents, a certain framing is inevitable and is not judged to have any substantial impact on the results. Awareness of action strategies has been highlighted in the literature as an important cognitive predictor for pro-environmental behavior [37,45]. We argue that for most consumers, choosing eco-labeled alternatives is the most feasible action strategy, although other approaches, such as seafood recommendation lists, are also viable alternatives [69]. Our results show that recognition of eco-labels for seafood (together with concern for negative environmental impacts) constitutes the variable that most strongly influences respondents’ stated purchasing of eco-labeled seafood. This result supports recent findings where recognition and understanding of eco-labels for food products was positively correlated with label use [70]. Our results also corroborate findings from earlier work stressing that concern for environmental impacts from seafood production is positively correlated with stated purchasing of eco-labeled seafood [6,10,12]. Level of concern was weakly, yet significantly, positively correlated with recognition of seafood eco-labels (linear regression, R2 = 0.06, p < 0.01). Grunert et al. [70] similarly found a weak positive correlation between concern about sustainability issues (environmental and social) related to food production and use of information provided by sustainability labels.
Though concern and awareness of eco-labels were the two most important variables predicting stated purchasing of eco-labeled seafood, two other internal factors were also highly relevant. Identity and PCE both predicted significant effects on stated purchasing of eco-labeled seafood in the best model. The importance of the predictors self-identification and membership in an environmental organization (here, captured by identity) has been identified in previous work [8,28]. Perceived consumer effectiveness (PCE) was the fourth most important variable in predicting stated purchasing behavior and is likely an important component of the decision making process, since it implies a perception that the individual’s actions are of significance. There was little evidence in our findings that demographic variables had an effect on stated purchasing of eco-labeled seafood. The lack of relationship between gender or level of education and pro-environmental behavior is in line with earlier research showing limited effects of demographic factors [71]. However, it contrasts with work showing that female and well-educated consumers are more prone to buy eco-labeled seafood alternatives than are other people [12,13,72].
Limited knowledge on how food is produced and the environmental implications of production has been conceptualized as food illiteracy [73] and could constitute a barrier for sustainable food consumption. Though the results from this study showed that objective environmental knowledge is a comparatively weak predictor of stated purchasing of eco-labeled seafood, there appears to be an association between the cognitive and emotional components of consumer decision making [74]. Provision of environmental knowledge may induce an emotional response stimulating pro-environmental behavior [75], and the other way around, an individual who is emotionally engaged might be more prone to search for knowledge in order to learn more about how food is produced and the environmental effects of production practices (both positive and negative) [76]. The link between subjective knowledge pertaining to marine environmental impacts and level of concern has been highlighted in recent research [68], supporting the association between self-identification and emotional engagement. The level of subjective knowledge in this study is consistent with earlier work dealing with seafood consumers’ self-stated level of knowledge (e.g., [14]). However, in contrast to work by [23,25], the results from multi-model averaging indicate that objective knowledge is a better predictor of eco-labeled seafood purchasing than subjective knowledge. Worth noting, however, is that both variables (obj. knowledge and subj. knowledge) were weak predictors of eco-labeled seafood purchase compared with other variables.
The average frequency of stated purchasing eco-labeled seafood in this study was 3.43 ± 1.00 (mean ± SD) on a five-point scale, indicating that the majority of respondents state that they sometimes choose an eco-labeled seafood alternative when available. Important to note here is that 39% of the yearly sales value (2013/2014) of frozen seafood in Sweden currently is eco-labeled by the MSC, and 2% is labeled as organic [77]. Some of the respondents participating in this study might thus choose eco-labeled seafood unintentionally, but state otherwise in the questionnaire. It is, however, worth considering that a relatively small proportion of farmed and fresh seafood (both farmed and wild-caught) is eco-labeled in Sweden. This should be viewed in the context of two clear trends in Swedish seafood retailing: (a) that the demand for salmon (by the time of writing, the most popular seafood), of which the great majority is farmed, has increased substantially in the last few years (34% increase in the volume sold between 2010 and 2012); and (b) that the demand for fresh seafood has increased at the expense of frozen, conserved and canned seafood [78]. The results of this work could therefore be of interest for actors aiming to shift farmed and fresh seafood consumption (as well as non-labeled wild-caught frozen seafood) towards improved sustainability.
The relatively low explanatory power of the best linear regression model generated by MMI (adjusted R2 0.26) indicates that additional factors, most likely external, e.g., price and availability, influence whether consumers choose to buy eco-labeled seafood alternatives. Internal factors not specifically measured in this study, e.g., positive feelings of purchasing labeled alternatives, could also affect the demand for eco-labeled seafood. Given the potential existence of an intention-behavior gap [39], a possible weakness of this study is that the measure for sustainable seafood consumption was restricted to individuals’ stated behavior and not complemented by figures on revealed preferences, e.g., market observations or experimental data. Moreover, we acknowledge that using Stockholm and Sweden as a case may limit the applicability of results to regions where the interest for ethical consumption is relatively high. However, on the other hand, results from this study pointing towards a low level of awareness of negative environmental impacts and seafood eco-labels among consumers in presumably one of the most pro-environmental consumption-oriented markets in the world are likely of relevance for the sustainable seafood movement as a whole. While this study investigated factors influencing stated purchasing of eco-labeled seafood, we recognize that consumer demand is only one out of many potential drivers towards increasing the share of eco-certified seafood on global markets and enhancing the environmental sustainability of the seafood sector. Other mechanisms (e.g., consumer choice editing by retailers and wholesalers, implementation of legislation and code of conducts for production) are also highly relevant, particularly in emerging economies where pro-environmental consumption is a relatively recent and immature phenomenon.

5. Conclusions

If eco-certification directed towards consumers is to be an effective tool for reducing negative environmental impacts from aquaculture and fisheries, consumer (and/or retailer) demand for eco-labeled seafood products needs to increase. Our empirical analysis in the Stockholm area, Sweden, revealed some of the key internal factors that appear important for predicting pro-environmental seafood consumption behavior. Early models of pro-environmental behavior stressed the significance of the provision of information and knowledge creation in the process of altering human behavior. Though these rather simplistic models were rejected decades ago by the large majority of scholars [37], a primary focus of UN organs and NGO-led campaigns aiming to promote pro-environmental consumption has still been on increasing the level of environmental knowledge in order to alter consumer behavior. This study confirms results from earlier work demonstrating the limitations of focusing solely on the provision of information in shifting consumer behavior towards more environmentally sustainable practices. Findings show that awareness of action strategies, in our case recognition and stated understanding of eco-labels, can be a more important predictor of stated eco-labeled seafood purchasing and, thus, that consumers’ familiarity with labels needs to increase. While an increased level of objective knowledge most likely influences the level of concern for negative environmental impacts, we argue that consumer-oriented campaigns should increasingly take emotive aspects into consideration, e.g., by providing emotionally engaging narratives, and thereby create long-lasting pro-environmental attitudes towards eco-labeled seafood.

Acknowledgments

This work was supported by Sida (the Swedish International Development Cooperation Agency), the Swedish Research Council VR (proj. No. SWE-2011-38) and the Erling-Persson Family Foundation through the ‘Global Economic Dynamics and the Biosphere’ program. The authors thank Johan Eklöf and Therese Lindahl for valuable comments on an earlier version of this manuscript.

Author Contributions

Malin Jonell, Beatrice Crona, Patrik Rönnbäck and Max Troell designed the survey and wrote the paper. Kelsey Brown and Malin Jonell conducted all of the data collection. Malin Jonell, Beatrice Crona and Kelsey Brown performed the statistical analysis. All authors read and approved the final manuscript and participated in joint discussions.

Conflicts of Interest

The authors declare no conflict of interest.

Appendix A

Appendix A.1. Questionnaire

I
How often do you buy seafood in grocery stores?
Once/a couple of times per week
Once/a couple of times per month
Once/a couple of times per year
Never
II
Do you buy eco-labeled seafood (e.g., KRAV, MSC) when available?
No
Not very often
Sometimes,
Often,
Yes, always
III
To what extent do you think you as a consumer contribute to more sustainable aquaculture and fisheries practices by purchasing eco-labeled seafood alternatives?
  • 1. Not at all → 5. In a very high extent
  • Don’t know
IV
Do you recognize the following eco-labels for seafood?
  • Labels presented: MSC, ASC, Fish for Life EcoFish and KRAV
    Don’t recognize
    Recognize
    Recognize and know the meaning of the scheme
V
How do you perceive your knowledge level when it comes to how seafood is produced (aquaculture and capture fisheries)?
  • I perceive I have a relatively low level of knowledge → 5. I feel relatively knowledgeable
VI
Choose the alternative you believe is the correct one.
(1)
Salmon is farmed in: (a) Ponds on land; (b) Net pens in the ocean; (c) Indoor ponds
(2)
Mussel farming can have a positive impact on the environment since they: (a) Functions as spawning-grounds for cod; (b) Can decrease the amount of nutrients in the water; (c) Functions as nurseries for eels
(3)
Farming of tropical prawns has been criticized for: (a) Logging of rainforest to build dams; (b) To cause acidification in tropical countries; (c) Mangrove deforestation to build dams
(4)
Pangasius, Striped catfish, sold in Sweden most often comes from: (a) Vietnam; (b) Thailand; (c) Norway
(5)
The national food agency recommends limited consumption of Baltic herring because of high levels of: (a) DDT; (b) Dioxin; (c) Antibiotics
(6)
Which of the following species are ‘ok to eat’ in terms of environmental sustainability according to the fish guide from WWF Sweden (2012): (a) Swordfish; (b) Monkfish; (c) Lobster (cages)
(7)
Northern prawns are fished mainly through the use of: (a) Drift nets; (b) Trawling; (c) Cages
(8)
Wild caught fish sold in Sweden is often labeled “FAO 27”. What does “FAO 27” stand for?, (a) Caught in the Northeast Atlantic; (b) caught in the Baltic Sea; (c) Caught in Kattegatt
I
From where do you obtain information on environmental impacts from capture fisheries/aquaculture from?
  • Sources presented: Retailers/groceries, Authorities, Environmental NGOs, Producers/fishermen, Media, Friends/colleagues and Own alternative
    • Get no information from → 5. Get a lot of information from
II
Do you feel worried about negative environmental impacts from fisheries and aquaculture?
  • 1. No, not at all → 5. Yes, very worried
  • Don’t know
III
Do you perceive yourself as an environmentally conscious person?
  • No, not at all → 5. Yes, definitely
IV
To what extent should the following actors be responsible for an environmentally sustainable production of seafood?
  • Actors presented:
  • Consumers, Retailers/groceries, Authorities (through provision of information), The government (legislation), Environmental NGOs, Companies (importers/wholesale dealers), Media (newspapers/radio/TV) and Own alternative
  • 1. Should not have any responsibility → 5. Should have major responsibility
V
Age
  • <24; 25–34; 35–44; 45–54; 55–65; 65–74; >74
VI
Gender
Male
Female
Other
VII
Education
Not finalized primary school
Primary school
High school/upper secondary school
University
VIII
Place of residence
Stockholm, Gothenburg, Malmö (>250,000 inhabitants)
City (30,000–249,999 inhabitants)
Smaller city (200–29,999 inhabitants)
Countryside (<200 inhabitants)
IX
Are there any children in the household?
Yes
No
X
Are you member in any environmental organization?
Yes
No

Appendix A.2. Coding Questions from Questionnaire for Statistical Analysis

The questions aiming to capture factors of interest for the statistical analysis (MMI) were coded in order to translate qualitative variables to quantitative measures (Table A1). The dependent variable (stated purchasing of eco-labeled seafood, Question II) was coded according to the five-point Likert scale provided (1–5 points).
Table A1. Coding of questions from the questionnaire in preparation for statistical analysis of which factors are correlated with purchasing of eco-labeled seafood.
FactorVariable MeasuredQuestion No.Final Measure in Analysis
Environmental knowledge (issues) (obj. knowledge)Knowledge on environmental impacts of seafood productionVITotal number of correct answers (0–8 points)
Awareness of action strategies (labels)Recognition of eco-labels for seafoodIVTotal number of real labels recognized (1 point) or recognized and understood (2 points), giving a maximum of 4 × 2 points
Subjective knowledge (subj. knowledge)Consumer perceived knowledge levelVPerceived subjective knowledge on a five-point scale (1–5 points)
Pro-environmental identity (identity)Perception of being an environmentally-conscious person and membership in an environmental NGOIX and XVIA binary version of Question IX (0–3 recoded to 0 and 4–5 recoded to 1) combined with Question XVI (0 or 1), giving a total range of 0–2 points.
Sense of responsibility (responsibility)Think that consumers should have a major responsibilityXPerceived consumer responsibility (1–5 points)
Worry for negative environmental impacts (concern)Concern for environmental impacts from seafood productionVIIIConcern as expressed on the five-point scale (1–5 points)
Perceived consumer efficiency (PCE)Beliefs that purchasing of eco-labeled seafood on an individual level can make a differenceIXPCE (1–5 points)
GenderGenderXIIBinary variable (0/1)
EducationLevel of educationXIIILower education (0 point), university degree (1 point); binary variable (0/1)

Appendix B. Model Averaging

Model averaging implies multiplying the standardized β-coefficients for each variable included in the full model with the model weight for each model in order to obtain a weighted estimate of the β-coefficient across all models. Since the support of the best models was moderate (the AIC weight of the best model was 0.06), we decided to conduct model averaging, including shrinkage, or full model averaging, thus include all of the models (n = 512) in the calculation [53]. For a model where the variable of interest is not included, the model weight is multiplied by zero. This implies that a variable included primarily in low weight models will be “punished” through a smaller model averaged β-coefficient than a variable included in high weight models.

Appendix C

Figure C1. Importance of the explanatory variables expressed as the cumulative weights of models containing the variable. “Labels” and “concern” were included in all of the high weight models and therefore had a cumulative weight of 100%.
Sustainability 08 00884 g003

References

  1. Pauly, D.; Christensen, V.; Guénette, S.; Pitcher, T.J.; Sumaila, U.R.; Walters, C.J.; Watson, R.; Zeller, D. Towards sustainability in world fisheries. Nature 2002, 418, 689–695. [Google Scholar] [CrossRef] [PubMed]
  2. Troell, M.; Kautsky, N.; Beveridge, M.; Henriksson, P.; Primavera, J.; Rönnbäck, P.; Folke, C. Aquaculture. In Encyclopedia of Biodiversity, 2nd ed.; Levin, S.A., Ed.; Academic Press: Waltham, MA, USA, 2013; Volume 1, pp. 189–201. [Google Scholar]
  3. Rist, L.; Felton, A.; Nyström, M.; Troell, M.; Sponseller, R.A.; Bengtsson, J.; Österblom, H.; Lindborg, R.; Tidåker, P.; Angeler, D.G.; et al. Applying resilience thinking to production ecosystems. Ecosphere 2014, 5, 1–11. [Google Scholar] [CrossRef]
  4. MSC. MSC Global Impacts Report 2014; MSC: London, UK, 2014; p. 44. [Google Scholar]
  5. Jonell, M.; Phillips, M.; Rönnbäck, P.; Troell, M. Eco-Certification of Farmed Seafood: Will It Make a Difference? Ambio 2013, 42, 659–674. [Google Scholar] [CrossRef] [PubMed]
  6. Roheim, C.A.; Sudhakaran, P.O.; Durham, C.A. Certification of Shrimp and Salmon for Best Aquaculture Practices: Assessing Consumer Preferences in Rhode Island. Aquac. Econ. Manag. 2012, 16, 266–286. [Google Scholar] [CrossRef]
  7. Johnston, R.J.; Roheim, C.A. A Battle of Taste and Environmental Convictions for Ecolabeled Seafood: A Contingent Ranking Experiment. J. Agric. Resour. Econ. 2006, 31, 283–300. [Google Scholar]
  8. Johnston, R.J.; Wessells, C.R.; Donath, H.; Asche, F. Measuring Consumer Preferences for Ecolabeled Seafood: An International Comparison. J. Agric. Resour. Econ. 2001, 26, 20–39. [Google Scholar]
  9. Uchida, H.; Roheim, C.A.; Wakamatsu, H.; Anderson, C.M. Do Japanese consumers care about sustainable fisheries? Evidence from an auction of ecolabelled seafood. Aust. J. Agric. Resour. Econ. 2013, 57, 1–18. [Google Scholar] [CrossRef]
  10. Wessells, C.R.; Johnston, R.J.; Donath, H. Assessing consumer preferences for ecolabeled seafood: The influence of species, certifier, and household attributes. Am. J. Agric. Econ. 1999, 81, 1084–1089. [Google Scholar] [CrossRef]
  11. Honkanen, P.; Young, J.A. What determines British consumers’ motivation to buy sustainable seafood? Br. Food J. 2015, 117, 1289–1302. [Google Scholar] [CrossRef]
  12. Brécard, D.; Hlaimi, B.; Lucas, S.; Perraudeau, Y.; Salladarré, F. Determinants of demand for green products: An application to eco-label demand for fish in Europe. Ecol. Econ. 2009, 69, 115–125. [Google Scholar] [CrossRef]
  13. Salladarré, F.; Guillotreau, P.; Perraudeau, Y.; Monfort, M.-C. The Demand for Seafood Eco-Labels in France. J. Agric. Food Ind. Organ. 2010. [Google Scholar] [CrossRef]
  14. Verbeke, W.; Vanhonacker, F.; Sioen, I.; van Camp, J.; de Henauw, S. Perceived importance of sustainability and ethics related to fish: A consumer behavior perspective. Ambio 2007, 36, 580–585. [Google Scholar] [CrossRef]
  15. Whitmarsh, D.; Wattage, P. Public attitudes towards the environmental impact of salmon aquaculture in Scotland. Eur. Environ. 2006, 16, 108–121. [Google Scholar] [CrossRef]
  16. Roheim, C.A.; Asche, F.; Santos, J.I. The Elusive Price Premium for Ecolabelled Products: Evidence from Seafood in the UK Market. J. Agric. Econ. 2011, 62, 655–668. [Google Scholar] [CrossRef]
  17. Sogn-Grundvåg, G.; Larsen, T.A.; Young, J.A. The value of line-caught and other attributes: An exploration of price premiums for chilled fish in UK supermarkets. Mar. Policy 2012, 38, 41–44. [Google Scholar] [CrossRef]
  18. Boström, M.; Klintman, M. Eco-Standards, Product Labelling and Green Consumerism; Palgrave MacMillan: Houndmills, UK, 2008. [Google Scholar]
  19. Röös, E.; Tjärnemo, H. Challenges of carbon labelling of food products: A consumer research perspective. Br. Food J. 2011, 113, 982–996. [Google Scholar] [CrossRef]
  20. Ekoweb. Ekologisk Livsmedelsmarknad. 2016. Available online: http://www.e-pages.dk/maskinbladet/1180/html5/ (accessed on 8 June 2016). (In Swedish)
  21. Magnusson, M.K.; Arvola, A.; Hursti, U.-K.K.; Åberg, L.; Sjödén, P.-O. Attitudes towards organic foods among Swedish consumers. Br. Food J. 2001, 103, 209–226. [Google Scholar] [CrossRef]
  22. Seyfang, G. Shopping for Sustainability: Can Sustainable Consumption Promote Ecological Citizenship? Env. Politics 2005, 14, 290–306. [Google Scholar] [CrossRef]
  23. Ellen, P.S. Do We Know What We Need to Know? Objective and Subjective Knowledge Effects on Pro-Ecological Behaviors. J. Bus. Res. 1994, 30, 43–52. [Google Scholar] [CrossRef]
  24. Grunert, K.G.; Wills, J.M. A review of European research on consumer response to nutrition information on food labels. J. Public Health (Bangkok) 2007, 15, 385–399. [Google Scholar] [CrossRef]
  25. Pieniak, Z.; Aertsens, J.; Verbeke, W. Subjective and objective knowledge as determinants of organic vegetables consumption. Food Qual. Preference 2010, 21, 581–588. [Google Scholar] [CrossRef]
  26. Rousseau, S.; Vranken, L. Green market expansion by reducing information asymmetries: Evidence for labeled organic food products. Food Policy 2013, 40, 31–43. [Google Scholar] [CrossRef]
  27. Pieniak, Z.; Verbeke, W.; Scholderer, J.; Brunso, K.; Olsen, S.-O. European consumers’ use of and trust in information sources about fish. Food Qual. Preference 2007, 18, 1050–1063. [Google Scholar] [CrossRef]
  28. Sparks, P.; Shepherd, R. Self-Identity and the Theory of Planned Behavior: Assesing the Role of Identification with “Green Consumerism”. Soc. Psychol. Q. 1992, 55, 388–399. [Google Scholar] [CrossRef]
  29. Grob, A. A structural model of environmental attitudes and behaviour. J. Environ. Psychol. 1995, 15, 209–220. [Google Scholar] [CrossRef]
  30. Roberts, J.A.; Bacon, D.R. Exploring the Subtle Relationships between Environmental Concern and Ecologically Conscious Consumer Behavior. J. Bus. Res. 1997, 40, 79–89. [Google Scholar] [CrossRef]
  31. Peattie, K. Green Consumption: Behavior and Norms. Annu. Rev. Environ. Resour. 2010, 35, 195–228. [Google Scholar] [CrossRef]
  32. Straughan, R.D.; Roberts, J.A. Environmental segmentation alternatives: A look at green consumer behavior in the new millennium. J. Consum. Mark. 1999, 16, 558–575. [Google Scholar] [CrossRef]
  33. Vermeir, I.; Verbeke, W. Sustainable Food Consumption: Exploring the Consumer “Attitude-Behavioral Intention” Gap. J. Agric. Environ. Ethics 2006, 19, 169–194. [Google Scholar] [CrossRef]
  34. Gilg, A.; Barr, S.; Ford, N. Green consumption or sustainable lifestyles? Identifying the sustainable consumer. Futures 2005, 37, 481–504. [Google Scholar] [CrossRef]
  35. Van Liere, K.D.; Dunlap, R.E. Environmental Concern: Does It Make a Difference How It’s Measured? Environ. Behav. 1981, 13, 651–676. [Google Scholar] [CrossRef]
  36. Peattie, K. Golden goose or wild goose, the hunt for the green consumer. Bus. Strateg. Environ. 2001, 10, 187–199. [Google Scholar] [CrossRef]
  37. Kollmuss, A.; Agyeman, J. Mind the gap: Why do people act environmentally and what are the barriers to pro-environmental behavior? Environ. Educ. Res. 2002, 8, 239–260. [Google Scholar] [CrossRef]
  38. Ouellette, J.A.; Wood, W. Habit and Intention in Everyday Life: The Multiple Processes by Which Past Behavior Predicts Future Behavior. Psychol. Bull. 1998, 124, 54–74. [Google Scholar] [CrossRef]
  39. Carrington, M.J.; Neville, B.A.; Whitwell, G.J. Why ethical consumers don’t walk their talk: Towards a framework for understanding the gap between the ethical purchase intentions and actual buying behaviour of ethically minded consumers. J. Bus. Ethics 2010, 97, 139–158. [Google Scholar] [CrossRef]
  40. Blumenschein, K.; Blomquist, G.C.; Johannesson, M.; Horn, N.; Blumenschein, K.; Blomquist, G.C.; Johannesson, M.; Horn, N. Eliciting Willingness to Pay without Bias: Evidence from a Field Experiment Published by: Wiley on behalf of the Royal Economic Society Stable. Econ. J. 2008, 118, 114–137. [Google Scholar] [CrossRef]
  41. Lusk, J.L. Effects of cheap talk on consumer willingness-to-pay for golden rice. Am. J. Agric. Econ. 2003, 85, 840–856. [Google Scholar] [CrossRef]
  42. Sanctuary, M.; Friberg, R. What´s holding it back? A study in organic retail coffee purchases. In Essays on Trade and Environment; Department of Economics, Stockholm University: Stockholm, Sweden, 2013; pp. 85–110. [Google Scholar]
  43. Aertsens, J.; Verbeke, W.; Mondelaers, K.; van Huylenbroeck, G. Personal determinants of organic food consumption: A review. Br. Food J. 2009, 111, 1140–1167. [Google Scholar]
  44. Thøgersen, J. Consumer behaviour and the environment: Which role for information? In Environment, Information and Consumer Behaviour; Edward Elgar: Cheltenham, UK, 2005; pp. 51–63. [Google Scholar]
  45. Hines, J.; Hungerford, H.; Tomera, A. Analysis and synthesis of research on responsible environmental behavior: A meta-analysis. J. Environ. Educ. 1987, 18, 1–8. [Google Scholar] [CrossRef]
  46. Stern, P. Information, incentives, and proenvironmental consumer behavior. J. Consum. Policy 1999, 22, 461–478. [Google Scholar] [CrossRef]
  47. Statistics Sweden. 2012. Available online: http://www.scb.se/en_/ (accessed on 1 September 2016).
  48. Pieniak, Z.; Verbeke, W.; Olsen, S.O.; Hansen, K.B.; Brunsø, K. Health-related attitudes as a basis for segmenting European fish consumers. Food Policy 2010, 35, 448–455. [Google Scholar] [CrossRef]
  49. Loo, R. A caveat on using single-item versus multiple-item scales. J. Manag. Psychol. 2001, 17, 68–75. [Google Scholar] [CrossRef]
  50. Wanous, J.P.; Reichers, A.E.; Hudy, M.J. Overall job satisfaction: How good are single-item measures? J. Appl. Psychol. 1997, 82, 247–252. [Google Scholar] [CrossRef] [PubMed]
  51. Thøgersen, J. Psychological determinants of paying attention to eco-labels in purchase decisions: Model development and multinational validation. J. Consum. Policy 2000, 23, 285–313. [Google Scholar] [CrossRef]
  52. Burnham, K.P.; Anderson, D.R.; Huyvaert, K.P. AIC model selection and multimodel inference in behavioral ecology: Some background, observations, and comparisons. Behav. Ecol. Sociobiol. 2011, 65, 23–35. [Google Scholar] [CrossRef]
  53. Symonds, M.R.E.; Moussalli, A. A brief guide to model selection, multimodel inference and model averaging in behavioural ecology using Akaike’s information criterion. Behav. Ecol. Sociobiol. 2010, 65, 13–21. [Google Scholar] [CrossRef]
  54. Burnham, K.; Anderson, D. Model Selection and Multimodel Inference, 2nd ed.; Springer-Verlag: New York, NY, USA, 2002. [Google Scholar]
  55. FAO. Salmo Salar. Available online: http://www.fao.org/fishery/culturedspecies/Salmo_salar/en (accessed on 9 April 2014).
  56. Rose, J.; Bricker, S.; Tedesco, M.A.; Wikfors, G. A role for shellfish aquaculture in coastal nitrogen management. Environ. Sci. Technol. 2014, 48, 2519–2525. [Google Scholar] [CrossRef] [PubMed]
  57. Primavera, J.H. Overcoming the impacts of aquaculture on the coastal zone. Ocean Coast. Manag. 2006, 49, 531–545. [Google Scholar] [CrossRef]
  58. Little, C.D.; Bush, S.R.; Belton, B.; Thanh Phuong, N.; Young, J.A.; Murray, F.J. Whitefish wars: Pangasius, politics and consumer confusion in Europe. Mar. Policy 2012, 36, 738–745. [Google Scholar] [CrossRef]
  59. Swedish National Food Agency. Guidance on Seafood Consumption. Available online: http://www.livsmedelsverket.se/livsmedel-och-innehall/oonskade-amnen/miljogifter/dioxiner-och-pcb/ (accessed on 22 July 2016). (In Swedish)
  60. WWF Fish Guide Sweden. 2014. Available online: http://www.wwf.se/press/pressrum/pressmeddelanden/1550885-ww-fs-fiskguide-2014-rtt-ljus-fr-vstkustrka-och-stenbitsrom (accessed on 9 April 2014). (In Swedish)
  61. FAO. Pandalus Borealis. Available online: http://www.fao.org/fishery/species/3425/en (accessed on 9 April 2014).
  62. FAO. Fishing Area 27. Available online: http://www.fao.org/fishery/area/Area27/en. (accessed on 9 April 2014).
  63. Onozaka, Y.; Uchida, H.; Morita, T.; Managi, S. Uninformed or Uninterested? Surveys Examine Japanese Consumers’ Interest in Sustainable Seafood. Available online: http://pdf.gaalliance.org/pdf/GAA-Onozaka-July10.pdf (accessed on 1 September 2016).
  64. Verbeke, W.; Sioen, I.; Brunsø, K.; de Henauw, S.; van Camp, J. Consumer perception versus scientific evidence of farmed and wild fish: Exploratory insights from Belgium. Aquac. Int. 2007, 15, 121–136. [Google Scholar] [CrossRef]
  65. MSC Undersökning om Attityder Och Kännedom. 2012. Available online: https://www.msc.org/dokument/informationsmaterial/konsumentundersokning/kondumentundersokning-2014/view (accessed on 12 November 2014). (In Swedish)
  66. Marine Stewardship Council. The Increasing Appetite for Sustainable Seafood. Available online: http://www.slideshare.net/MSCecolabel/msc-2014?next_slideshow=1 (accessed on 12 November 2014).
  67. Kalnikaitė, V.; Bird, J.; Rogers, Y. Decision-making in the aisles: Informing, overwhelming or nudging supermarket shoppers? Pers. Ubiquitous Comput. 2012, 17, 1247–1259. [Google Scholar] [CrossRef]
  68. Gelcich, S.; Buckley, P.; Pinnegar, J.K.; Chilvers, J.; Lorenzoni, I.; Terry, G.; Guerrero, M.; Castilla, J.C.; Valdebenito, A.; Duarte, C.M. Public awareness, concerns, and priorities about anthropogenic impacts on marine environments. Proc. Natl. Acad. Sci. USA 2014, 111, 15042–15047. [Google Scholar] [CrossRef] [PubMed]
  69. Oken, E.; Choi, A.L.; Karagas, M.R.; Mariën, K.; Rheinberger, C.M.; Schoeny, R.; Sunderland, E.; Korrick, S. Review Which Fish Should I Eat? Perspectives Influencing Fish Consumption Choices. Environ. Health Perspect. 2012, 120, 790–798. [Google Scholar] [CrossRef] [PubMed]
  70. Grunert, K.G.; Hieke, S.; Wills, J. Sustainability labels on food products: Consumer motivation, understanding and use. Food Policy 2014, 44, 177–189. [Google Scholar] [CrossRef]
  71. Diamantopoulos, A.; Schlegelmilch, B.B.; Sinkovics, R.R.; Bohlen, G.M. Can socio-demographics still play a role in profiling green consumers? A review of the evidence and an empirical investigation. J. Bus. Res. 2003, 56, 465–480. [Google Scholar] [CrossRef]
  72. Polymeros, K.; Kaimakoudi, E.; Mitsoura, A.; Nikouli, E.; Mente, E. The Determinants of Consumption for Organic Aquaculture Products—Evidence From Greece. Aquac. Econ. Manag. 2014, 18, 45–59. [Google Scholar] [CrossRef]
  73. Vidgen, H.; Gallegos, D. What Is Food Literacy and Does It Influence What We Eat: A Study of Australian Food Experts; Queensland University of Technology: Brisbane, Australian, 2011. [Google Scholar]
  74. Fraj-Andrés, E.; Martínez-Salinas, E. Impact of Environmental Knowledge on Ecological Consumer Behaviour. J. Int. Consum. Mark. 2008, 19, 73–102. [Google Scholar] [CrossRef]
  75. Brosdahl, D.J.C.; Carpenter, J.M. Consumer Knowledge of the Environmental Impacts of Textile and Apparel Production, Concern for the Environment, and Environmentally Friendly Consumption Behavior. J. Text. Appar. Technol. Manag. 2010, 6, 1–9. [Google Scholar]
  76. Zaichkowsky, J.L. Measuring the Involvement Construct. J. Consum. Res. 1985, 12, 341–352. [Google Scholar] [CrossRef]
  77. Nielsen, S. ScanTrack. Eco-Labeled Share of the Sales Value of Frozen Seafood from Swedish Retailers, August 2013–August 2014 (52 Weeks), 2014. Unpublished work. 2014. [Google Scholar]
  78. Kjelstrup, L.; Norges Sjömatsråd, Stockholm, Sweden. Personal communication, 2013.
Figure 1. Theoretical framework used in this study. The focus was particularly on the following factors: perceived consumer effectiveness, knowledge of issues, awareness of seafood eco-labels, environmental concern, subjective knowledge, self-identification and personal responsibility (independent factors measured in this study marked with *). Model adapted from Kollmuss and Agyeman (2002) [37].
Sustainability 08 00884 g001
Figure 2. Model averaged effect sizes with shrinkage for the independent variables included in the global model. Estimated coefficients with shrinkage and model averaged adjusted standard errors for the top most important variables. n = 371.
Sustainability 08 00884 g002
Table 1. Explanatory variables expected to affect the extent to which consumers state that they choose eco-labeled seafood when available. The association with the terms used in the theoretical framework in Figure 1 is presented in the ‘theoretical framework’ column, and ‘variable measured’ indicates how the factor was captured in the questionnaire.
Theoretical FrameworkFactors InvestigatedPostulated Relation to Stated Purchasing of Eco-Labeled Seafood (SPES)ReferencesVariable Measured
Knowledge (issues)Environmental knowledge (obj. knowledge)Knowledge of environmental impacts of seafood production is positively correlated with SPES[43,44]Knowledge pertaining to environmental impacts of seafood production
Awareness (action strategies)Awareness of action strategies (labels)Awareness of how to reduce negative impacts from seafood consumption is positively correlated with SPES[45]Recognition and stated understanding of eco-labels for seafood
Subjective knowledgeSubjective knowledge (subj. knowledge)Consumers’ perceived knowledge level is positively correlated with SPES[23,28]Consumer perceived knowledge level
Self-identificationPro-environmental identity (identity)Consumers’ identification as environmentally conscious is positively correlated with SPES[28,46]Perception of being an environmentally-conscious person and membership in an environmental NGO
Personal responsibilitySense of responsibility (responsibility)Consumers’ sense of personal responsibility positively correlates with SPES[37]Think that consumers should have a major responsibility for sustainable production of seafood
Environmental concernWorry for negative environmental impacts (concern)Concern for environmental impacts linked to seafood production is positively correlated with SPES[29,30]Concern for environmental impacts from seafood production
Perceived consumer effectiveness (PCE)Perceived consumer effectiveness (PCE)The extent to which the individual thinks he/she can make a difference by buying eco-labeled alternatives is positively correlated with SPES[23,33]Beliefs that purchasing eco-labeled seafood can contribute to better production practices
-GenderWomen more likely to conduct SPES than men[37]Gender
-EducationConsumers with higher education are more likely to conduct SPES than those with lower education[37]Level of education
Table 2. Demographic characteristics of the respondents participating in the study (n = 406).
This Study (%)Sweden * (2013) (%) This Study (%)Sweden * (2013) (%)
Age18–2411.89.6EducationLower education30.063.8
25–3424.116.4University70.034.4
35–4420.716.7
45–5415.017.1Member in E-NGOYes18.2NA
No81.8NA
55–6413.315.3
65–7411.814.0Children in householdYes36.229.1
No63.870.9
>753.210.9
GenderM45.150.0
F54.950.0
* Statistics Sweden [47].
Table 3. Survey questions aiming to capture respondents’ objective knowledge pertaining to seafood production. n = 406.
QuestionCorrect AnswerReferenceCorrect Answers (%) n = 406
1.Salmon is most often farmed inNet pens in the ocean[55]59.9
2.Mussel farming can have a positive impact on the environment since theyAbsorb nutrients in the water[56]61.1
3.Farming of tropical shrimp has been criticized forMangrove deforestation to build dams[57]65.3
4.Pangasius, striped catfish, sold in Sweden most often comes fromVietnam[58]52.0
5.The national food agency recommends limited consumption of Baltic herring because of high levels ofDioxin[59]64.5
6.Which of the following species are ‘ok to eat’ in terms of environmental sustainability, according to the fish guide from World Wildlife Fund (WWF) Sweden (2012)Lobster (cages)[60]52.5
7.Northern prawns are fished mainly through the use ofTrawls[61]73.2
8.Wild caught fish sold in Sweden is often labeled “FAO 27”. What does “FAO 27” stand for?Caught in the Northeast Atlantic[62]61.6
Table 4. Consumers’ recognition of eco-labels for seafood available on the Swedish market. n = 406. KRAV, Swedish organic scheme; MSC, Marine Stewardship Council; ASC, Aquaculture Stewardship Council.
Recognize (%)Recognize and Know Meaning (%)Total Recognition (%)
KRAV39.754.794.3
MSC31.312.844.1
Fish for Life19.54.724.1
ASC18.74.423.2
EcoFish (fake label)14.32.717.0
Table 5. The best models generated by multi-model inference (MMI) (ΔAIC < 2) and ΔAICc values, cumulative weights and evidence ratios for each model. Subjective knowledge was not included in any of the top models. n = 371.
LabelsConcernIdentityPCEobj. know.resp.Genderedu.ΔAICcCum. WeightEvidence Ratio
1xxxxxx 0.006.1%1.00
2xxxxx 0.0412.0%1.02
3xxxxxxx 0.2917.3%1.15
4xxxxx x 0.3322.4%1.18
5xxxx 0.7726.5%1.47
6xxxx x 1.0130.2%1.65
7xxxxx x1.5633.0%2.18
8xxxx x 1.6635.6%2.29
9xxxxxx x1.7438.2%2.38
10xxxxx xx1.8640.6%2.54
11xxxx xx 1.9242.9%2.61
Table 6. The best model generated by MMI (ΔAICc = 0) with modifications (variables removed), and the two models solely including the top three variables (concern, labels and identity).
ModelRankDfΔAICcWeightEvidence Ratio
Best model (labels + concern + identity + PCE + obj. know. + resp.)180.06.1%1.0
Best model minus concern132717.20.0%5454.9
Best model minus labels154720.40.0%27,115.7
Best model minus identity3073.70.9%6.4
Model only including concern + labels117411.60.0%328.6
Model only including concern + labels + identity3353.80.9%6.3

